PDB Management Operator - Technical Documentation
Table of Contents
Overview
The PDB (Pod Disruption Budget) Management Operator is a Kubernetes operator designed specifically for the ODA (Open Digital Architecture) Canvas project. It automates the creation and management of Pod Disruption Budgets based on deployment annotations and custom policies, ensuring high availability and controlled disruptions for applications running in Kubernetes clusters.
Key Benefits
Automated PDB Management: Automatically creates and updates PDBs based on deployment annotations
Policy-Based Configuration: Define organization-wide availability policies using CRDs
Flexible Enforcement: Three enforcement modes (Strict, Flexible, Advisory) for different scenarios
AI-Powered Intelligence: Integrated MCP server for cluster analysis and intelligent recommendations
ODA Canvas Integration: Seamlessly integrates with ODA Canvas component architecture
High Performance: Optimized for managing 200+ deployments with efficient caching
Maintenance Windows: Support for scheduled maintenance periods
Comprehensive Observability: Built-in metrics, tracing, and audit logging
Architecture Overview
graph TB
    subgraph cluster["Kubernetes Cluster"]
        subgraph inputs["Input Resources"]
            deployments["Deployments<br/>(with annotations)"]
            policies["AvailabilityPolicies<br/>(CRDs)"]
        end

        subgraph operator["PDB Management Operator"]
            subgraph controllers["Controllers"]
                dc["Deployment<br/>Controller"]
                pc["AvailabilityPolicy<br/>Controller"]
                wh["Webhook<br/>Server"]
            end

            subgraph shared["Shared Components"]
                cache["Cache"]
                metrics["Metrics"]
                events["Events"]
                tracing["Tracing"]
            end
        end

        pdbs["PDBs<br/>(auto-managed)"]
    end

    deployments --> dc
    policies --> pc
    dc --> shared
    pc --> shared
    wh --> shared
    shared --> pdbs
Full Reconciliation Sequence
The following diagram shows the complete sequence of operations during deployment reconciliation, including all enforcement modes and edge cases:
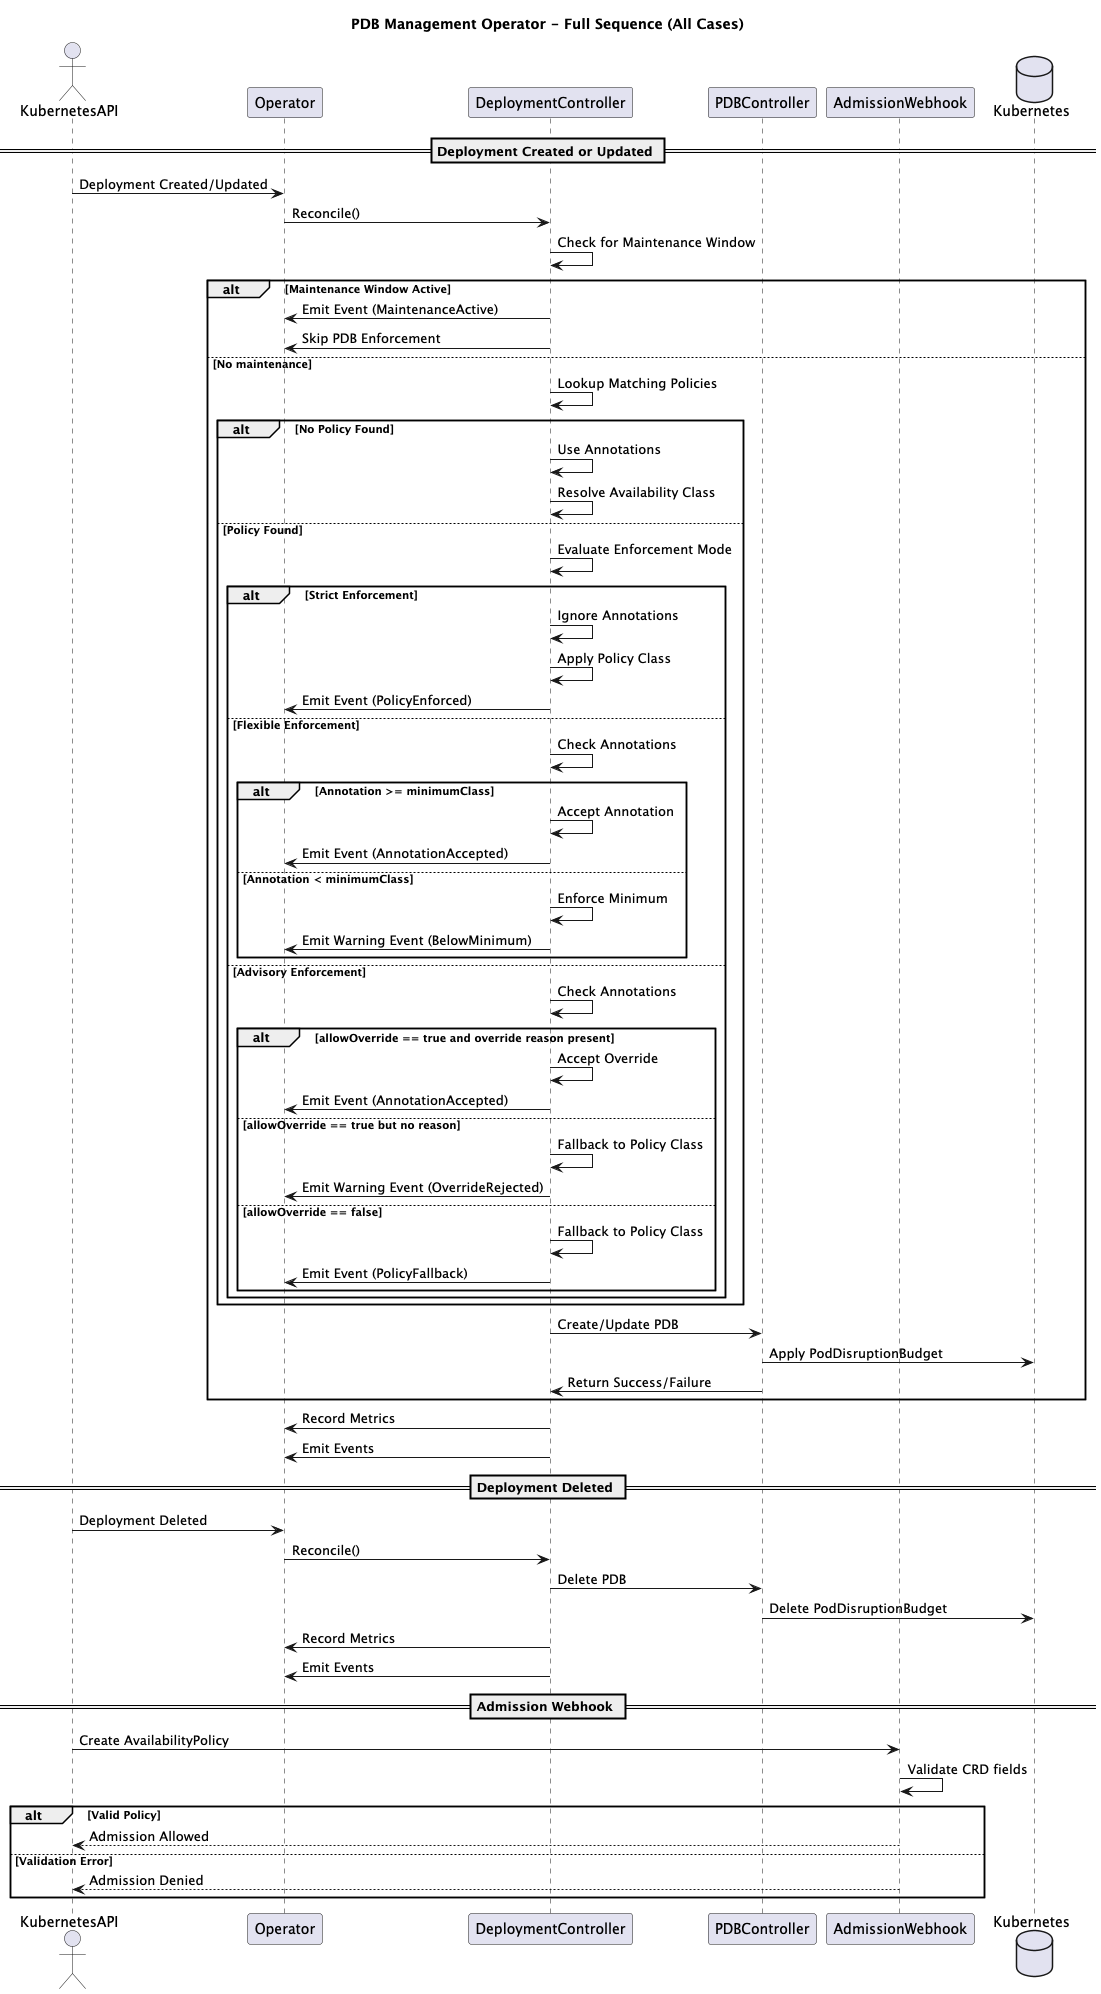
Architecture
Design Principles
Separation of Concerns: Distinct controllers handle different aspects
High Performance: Optimized for large-scale deployment environments with caching and circuit breakers.
Resilience: Circuit breaker pattern prevents cascading failures
Observability: Comprehensive metrics, tracing, and audit logging
Flexibility: Both annotation-based and policy-based configuration
Security: Least privilege RBAC, admission webhooks for validation
Controller Architecture
The operator implements two main controllers, an admission webhook, and an MCP server:
Deployment Controller: Watches deployments for availability annotations
AvailabilityPolicy Controller: Manages custom availability policies
Admission Webhook: Validates and defaults AvailabilityPolicy resources
MCP Server: Provides AI-powered cluster analysis and recommendations via Model Context Protocol
Data Flow
flowchart TD
    A[Deployment Created/Updated] --> B[Deployment Controller]
    B --> C{Check Annotations}
    C -->|Has Annotations| D[Annotation Based]
    C -->|No Annotations| E[Policy Based]
    E --> F[Policy Lookup]
    D --> G[Enforcement Logic<br/>Strict/Flexible/Advisory]
    F --> G
    G --> H[Calculate PDB Parameters]
    H --> I[Create/Update PDB]
Components
1. Deployment Controller
Responsible for:
Watching deployment changes
Extracting availability annotations
Looking up matching policies
Applying enforcement logic
Creating/updating PDBs
Key features:
Intelligent policy resolution with enforcement modes
Component function awareness
Maintenance window support
Efficient caching with TTL
2. AvailabilityPolicy Controller
Manages AvailabilityPolicy CRDs:
Validates policy specifications
Tracks policy usage
Handles policy updates
Manages policy priorities
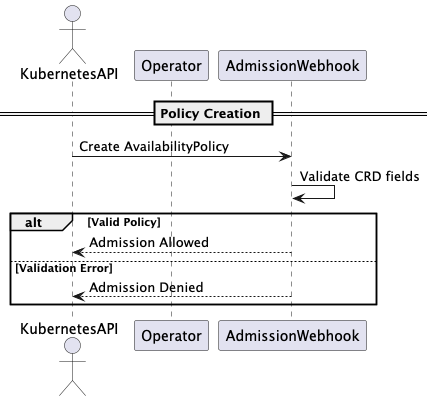
3. Admission Webhook
Provides:
Validation of AvailabilityPolicy resources
Defaulting of optional fields
Warning generation for best practices
Prevention of invalid configurations
MCP Server Architecture
The integrated Model Context Protocol (MCP) server extends the operator with AI-powered cluster analysis capabilities. This component enables intelligent recommendations and natural language interaction for cluster management.
MCP Components
graph TB
    subgraph mcpserver["MCP Server Layer"]
        subgraph tools["Tool Categories"]
            analysis["Analysis<br/>Tools"]
            recommendation["Recommendation<br/>Tools"]
            management["Management<br/>Tools"]
        end

        subgraph core["MCP Core Server"]
            protocol["Protocol<br/>Handler"]
            transport["Transport<br/>Layer"]
            registry["Tool<br/>Registry"]
            router["Request<br/>Router"]
        end
    end

    http["HTTP Transport<br/>(Port 8090)"]
    clients["MCP Clients"]

    analysis --> core
    recommendation --> core
    management --> core
    core --> http
    http --> clients
Analysis Tools
Cluster Availability Analysis
PDB coverage assessment across namespaces
Availability gap identification
Deployment risk analysis
Compliance reporting
Workload Pattern Detection
Automatic pattern classification (API, database, frontend, etc.)
Replica distribution analysis
Component function inference
Deployment characteristics analysis
Recommendation Engine
Availability Class Recommendations
AI-powered classification based on workload characteristics
Security component detection and upgrade suggestions
Confidence scoring for recommendations
Impact analysis for changes
Policy Recommendations
Cluster-wide policy analysis
Pattern-based policy generation
Conflict resolution suggestions
Priority optimization
Management Interface
Policy Creation
Interactive policy definition
Validation and conflict checking
Template-based policy generation
Impact Simulation
What-if analysis for policy changes
Deployment impact assessment
Risk evaluation before applying changes
Deployment Management
Annotation updates via natural language
Batch operations across multiple deployments
MCP Protocol Implementation
The server implements the full MCP specification:
JSON-RPC 2.0: Standard protocol for request/response
Tools: Structured function calls with typed parameters
Prompts: Template-based interaction patterns
Resources: Dynamic resource access and management
Notifications: Real-time updates and status changes
Security and Access Control
Network Policies: Restricted access via Kubernetes NetworkPolicy
Client Authentication: Support for authenticated MCP clients
Audit Logging: All MCP operations are logged with correlation IDs
Rate Limiting: Built-in protection against abuse
Integration Points
The MCP server integrates with all existing operator components:
Policy Cache: Leverages existing caching for performance
Event System: Publishes events for MCP operations
Metrics: Exposes MCP-specific metrics
Tracing: Full OpenTelemetry correlation with operator traces
Features
1. Enforcement Modes
The operator supports three enforcement modes for policies:
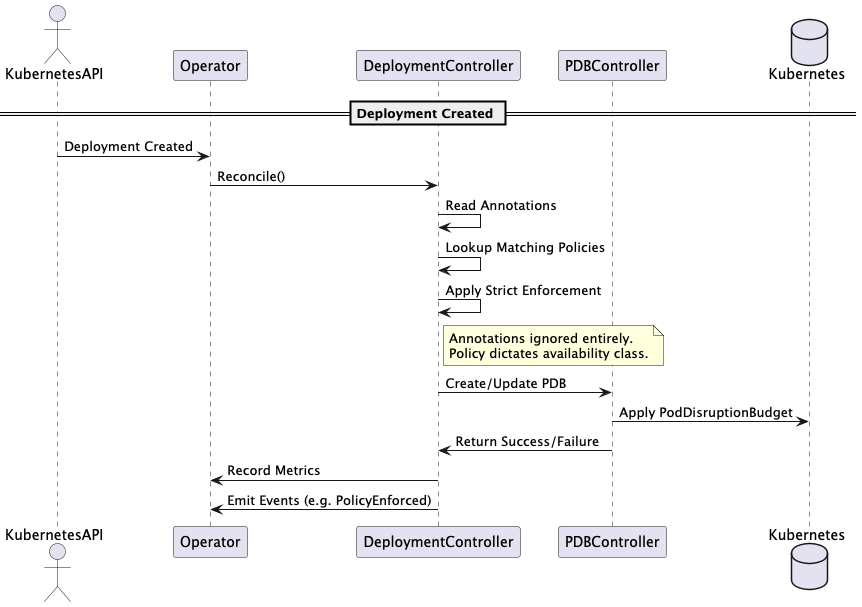
Strict Enforcement
Policy configuration always wins
Annotations are ignored even if present
Use for compliance-critical environments
spec:
  enforcement: strict
  availabilityClass: mission-critical
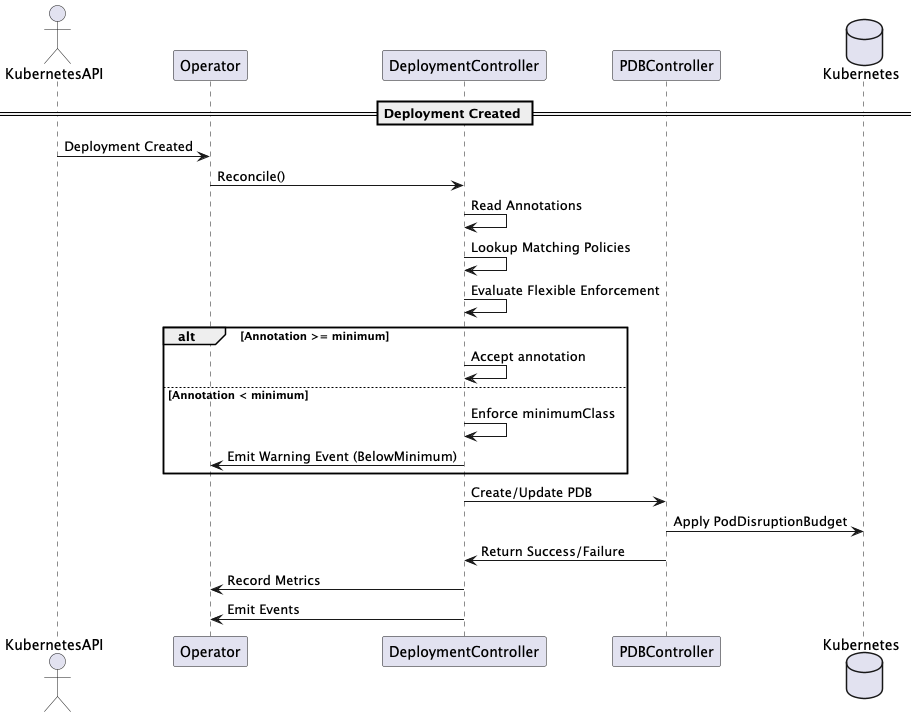
Flexible Enforcement
Annotations accepted if they meet minimum requirements
Allows teams to opt for higher availability
Prevents downgrading below minimum
spec:
  enforcement: flexible
  availabilityClass: high-availability
  minimumClass: standard # annotations must be >= standard
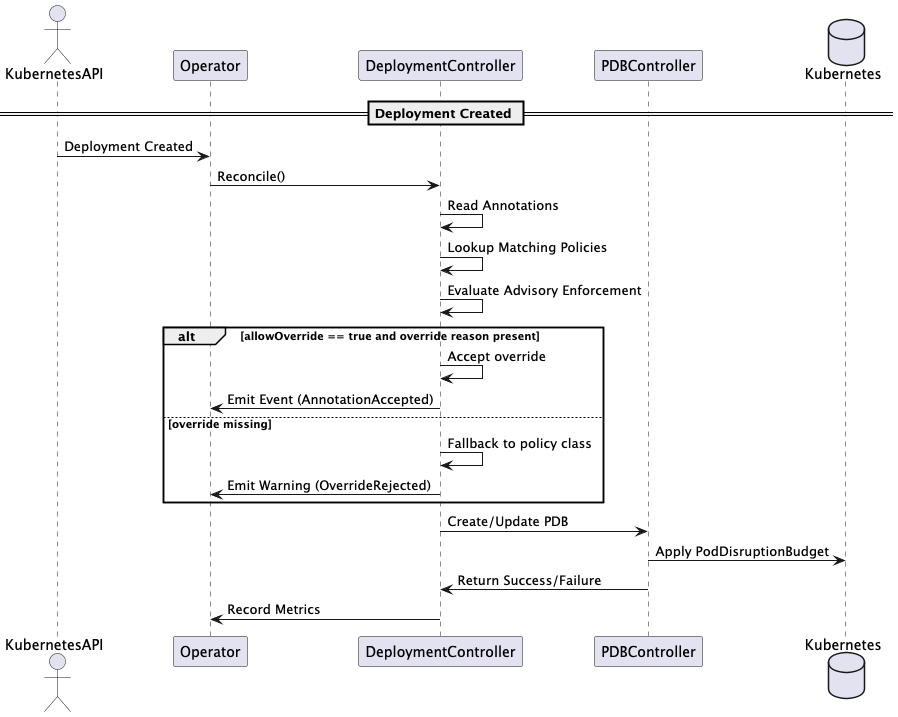
Advisory Enforcement
Annotations take precedence when present
Policy acts as fallback/default
Maximum flexibility for teams
spec:
  enforcement: advisory # default
  availabilityClass: standard
2. Component Function Intelligence
The operator automatically adjusts availability based on component function:
// Security components get upgraded availability
if componentFunction == "security" {
    switch availabilityClass {
    case "non-critical":
        return "standard"  // 20% → 50%
    case "standard":
        return "high-availability"  // 50% → 75%
    default:
        return availabilityClass
    }
}
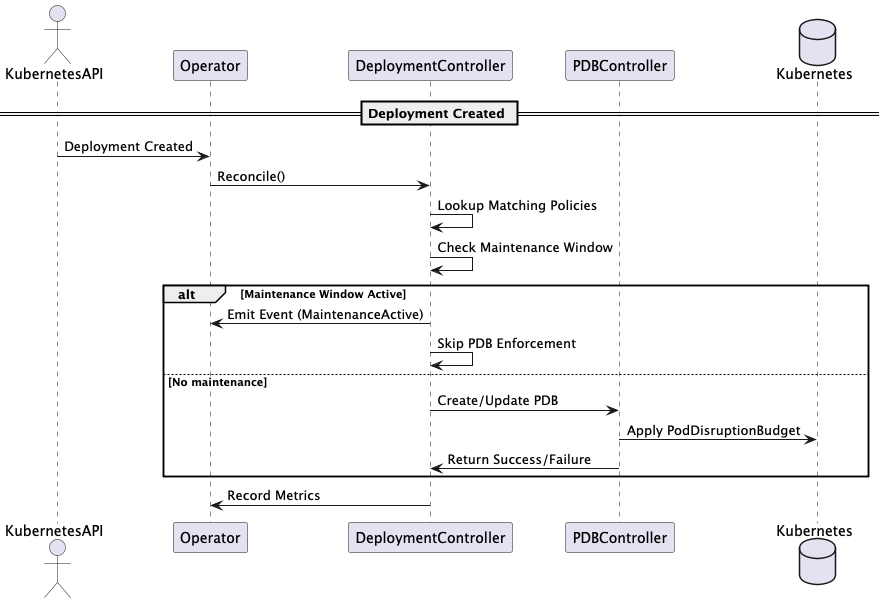
3. Maintenance Windows
Support for scheduled maintenance periods:
maintenanceWindows:
  - start: "02:00"
    end: "04:00"
    timezone: "UTC"
    daysOfWeek: [0, 6] # Sunday, Saturday
During maintenance windows:
PDB enforcement is temporarily suspended
Metrics indicate maintenance mode
Audit logs track window activation
4. Intelligent Caching
Performance optimization features:
Policy cache with 5-minute TTL
Maintenance window result caching
Circuit breaker integration
Reduces API server load
5. Circuit Breaker Protection
Prevents cascading failures:
Per-operation circuit breakers
Opens after 60% failure rate (3 requests minimum)
30-second timeout before retry
Automatic recovery
6. Comprehensive Observability
Metrics
PDB lifecycle metrics (created, updated, deleted)
Reconciliation performance metrics
Cache hit/miss ratios
Enforcement decision tracking
Policy conflict resolution
Tracing
OpenTelemetry integration
Distributed trace support
Correlation ID propagation
Audit Logging
All PDB operations logged
Policy decisions tracked
Override attempts recorded
Compliance-ready format
Configuration
Environment Variables
Variable |
Default |
Description |
|---|---|---|
|
|
Enable PDB controller |
|
|
Default namespace for operations |
|
|
Namespace for metrics |
|
|
Leader election namespace |
|
|
Logging level (debug, info, warn, error) |
|
|
Tracing sample rate (0.0-1.0) |
|
- |
Jaeger collector endpoint |
|
- |
OTLP collector endpoint |
|
- |
Custom availability class definitions (JSON) |
Operator Flags
--metrics-bind-address string      Metrics endpoint (default ":8080")
--health-probe-bind-address string Health probe endpoint (default ":8081")
--leader-elect                     Enable leader election (default true)
--watch-namespace string           Namespace to watch (empty = all)
--sync-period duration             Resync period (default 10h)
--enable-webhook                   Enable admission webhooks
--webhook-port int                 Webhook server port (default 9443)
--log-level string                 Log level (default "info")
--enable-tracing                   Enable OpenTelemetry tracing (default true)
--max-concurrent-reconciles int    Max concurrent reconciles (default 5)
Usage
Basic Usage - Annotation Based
The simplest way to use the operator is via deployment annotations:
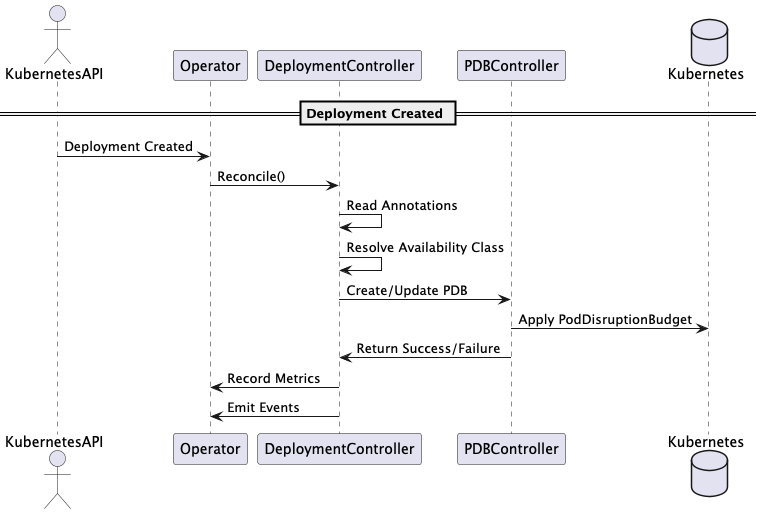
Add annotations to your deployment:
apiVersion: apps/v1
kind: Deployment
metadata:
  name: my-app
  annotations:
    oda.tmforum.org/availability-class: "standard"
    oda.tmforum.org/component-function: "core"
    oda.tmforum.org/componentName: "my-app-component"
spec:
  replicas: 3
  # ... rest of deployment spec
Operator automatically creates PDB:
apiVersion: policy/v1
kind: PodDisruptionBudget
metadata:
  name: my-app-pdb
  labels:
    oda.tmforum.org/managed-by: "pdb-management-operator"
spec:
  minAvailable: 50%
  selector:
    matchLabels:
      app: my-app
Policy-Based Configuration
Create an AvailabilityPolicy:
apiVersion: availability.oda.tmforum.org/v1alpha1
kind: AvailabilityPolicy
metadata:
  name: production-databases
spec:
  availabilityClass: mission-critical
  enforcement: flexible
  minimumClass: high-availability
  componentSelector:
    matchLabels:
      type: database
      environment: production
    componentFunctions: [core]
  priority: 100
  maintenanceWindows:
    - start: "02:00"
      end: "04:00"
      timezone: "UTC"
      daysOfWeek: [0] # Sunday only
Deploy matching workloads:
apiVersion: apps/v1
kind: Deployment
metadata:
  name: postgres-primary
  labels:
    type: database
    environment: production
  annotations:
    # This annotation will be accepted if >= high-availability
    oda.tmforum.org/availability-class: "mission-critical"
spec:
  replicas: 3
  # ... rest of deployment spec
API Reference
AvailabilityPolicy CRD
apiVersion: availability.oda.tmforum.org/v1alpha1
kind: AvailabilityPolicy
metadata:
  name: <policy-name>
spec:
  # Required: availability class for this policy
  availabilityClass: high-availability # non-critical|standard|high-availability|mission-critical|custom

  # Enforcement mode (default: advisory)
  enforcement: flexible # strict|flexible|advisory

  # Minimum class for flexible enforcement
  minimumClass: standard # only used with flexible enforcement

  # Component selector (at least one criterion required)
  componentSelector:
    # Select by namespaces
    namespaces:
      - production
      - staging

    # Select by component names
    componentNames:
      - payment-service
      - auth-service

    # Select by component functions
    componentFunctions:
      - core
      - security
      - management

    # Select by labels
    matchLabels:
      tier: critical

    # Select by expressions
    matchExpressions:
      - key: environment
        operator: In
        values: [prod, staging]
      - key: region
        operator: NotIn
        values: [test, dev]
      - key: sla
        operator: Exists

  # Priority for conflict resolution (default: 50)
  priority: 100 # 0-1000, higher wins

  # Maintenance windows
  maintenanceWindows:
    - start: "02:00"
      end: "04:00"
      timezone: "UTC"
      daysOfWeek: [0, 6] # 0=Sunday, 6=Saturday

  # Custom PDB configuration (only with custom availability class)
  customPDBConfig:
    minAvailable: "90%" # or absolute number like 2
    # OR
    maxUnavailable: 1 # or percentage like "10%"
    unhealthyPodEvictionPolicy: "IfHealthyBudget" # AlwaysAllow|IfHealthyBudget

  # Override controls
  allowOverride: true # Whether to allow annotation overrides (ignored in strict mode)
  overrideRequiresReason: true # Require override-reason annotation

  # Minimum replicas enforcement
  enforceMinReplicas: true # Ensure minimum replicas for availability class
Deployment Annotations
Annotation |
Required |
Description |
Example |
|---|---|---|---|
|
Yes* |
Availability class |
|
|
No |
Component function |
|
|
No |
Component identifier |
|
|
No |
Simple maintenance window |
|
|
No** |
Reason for override |
|
*Required unless matching an AvailabilityPolicy
**Required when policy has overrideRequiresReason: true
AvailabilityPolicy Deep Dive
Complete Feature Set
The AvailabilityPolicy CRD provides sophisticated control over PDB management:
1. Enforcement Modes with Examples
Strict Enforcement
apiVersion: availability.oda.tmforum.org/v1alpha1
kind: AvailabilityPolicy
metadata:
  name: security-strict-policy
spec:
  availabilityClass: mission-critical
  enforcement: strict  # Annotations completely ignored
  componentSelector:
    componentFunctions: [security]
  priority: 1000

# Deployment with annotation (will be ignored):
metadata:
  annotations:
    oda.tmforum.org/availability-class: "standard"  # IGNORED
# Result: PDB with 90% minAvailable (mission-critical from policy)
Flexible Enforcement
apiVersion: availability.oda.tmforum.org/v1alpha1
kind: AvailabilityPolicy
metadata:
  name: production-flexible
spec:
  availabilityClass: high-availability  # Recommended
  enforcement: flexible
  minimumClass: standard  # Minimum acceptable
  componentSelector:
    matchLabels:
      environment: production

# Scenario 1: Annotation meets minimum
annotations:
  oda.tmforum.org/availability-class: "mission-critical"
# Result: PDB with 90% (annotation accepted)

# Scenario 2: Annotation below minimum
annotations:
  oda.tmforum.org/availability-class: "non-critical"
# Result: PDB with 50% (minimum enforced), warning logged
Advisory with Controls
apiVersion: availability.oda.tmforum.org/v1alpha1
kind: AvailabilityPolicy
metadata:
  name: dev-advisory
spec:
  availabilityClass: standard
  enforcement: advisory
  allowOverride: true
  overrideRequiresReason: true
  componentSelector:
    matchLabels:
      environment: development

# Valid override:
metadata:
  annotations:
    oda.tmforum.org/availability-class: "non-critical"
    oda.tmforum.org/override-reason: "Batch processing workload"
# Result: PDB with 20% (override accepted)

# Invalid override (missing reason):
metadata:
  annotations:
    oda.tmforum.org/availability-class: "non-critical"
# Result: PDB with 50% (policy default), override rejected
2. Advanced Selection Capabilities
Multi-Namespace Policy
spec:
  componentSelector:
    namespaces:
      - production
      - staging
      - pre-prod
    matchLabels:
      managed-by: platform-team
Component Function Based
spec:
  componentSelector:
    componentFunctions:
      - core # Core business logic
      - security # Auth, encryption
      - management # Admin, monitoring
Complex Label Expressions
spec:
  componentSelector:
    matchExpressions:
      - key: tier
        operator: In
        values: [gold, platinum]
      - key: region
        operator: NotIn
        values: [dev, test]
      - key: sla
        operator: Exists
3. Custom PDB Configurations
Database-Specific Settings
apiVersion: availability.oda.tmforum.org/v1alpha1
kind: AvailabilityPolicy
metadata:
  name: database-custom
spec:
  availabilityClass: custom
  customPDBConfig:
    minAvailable: 2 # Absolute number for stateful sets
    unhealthyPodEvictionPolicy: "IfHealthyBudget"
  componentSelector:
    componentNames:
      - postgres-primary
      - postgres-secondary
Percentage with Specific Policy
spec:
  availabilityClass: custom
  customPDBConfig:
    maxUnavailable: "25%" # Different from minAvailable
    unhealthyPodEvictionPolicy: "AlwaysAllow"
4. Maintenance Window Configurations
Complex Maintenance Schedule
spec:
  maintenanceWindows:
    # Weekday maintenance (Mon-Fri 2-4 AM)
    - start: "02:00"
      end: "04:00"
      timezone: "UTC"
      daysOfWeek: [1, 2, 3, 4, 5]
    # Weekend maintenance (Sat-Sun all day)
    - start: "00:00"
      end: "23:59"
      timezone: "UTC"
      daysOfWeek: [0, 6]
5. Priority and Conflict Resolution
When multiple policies match a deployment, the operator uses priority to resolve conflicts:
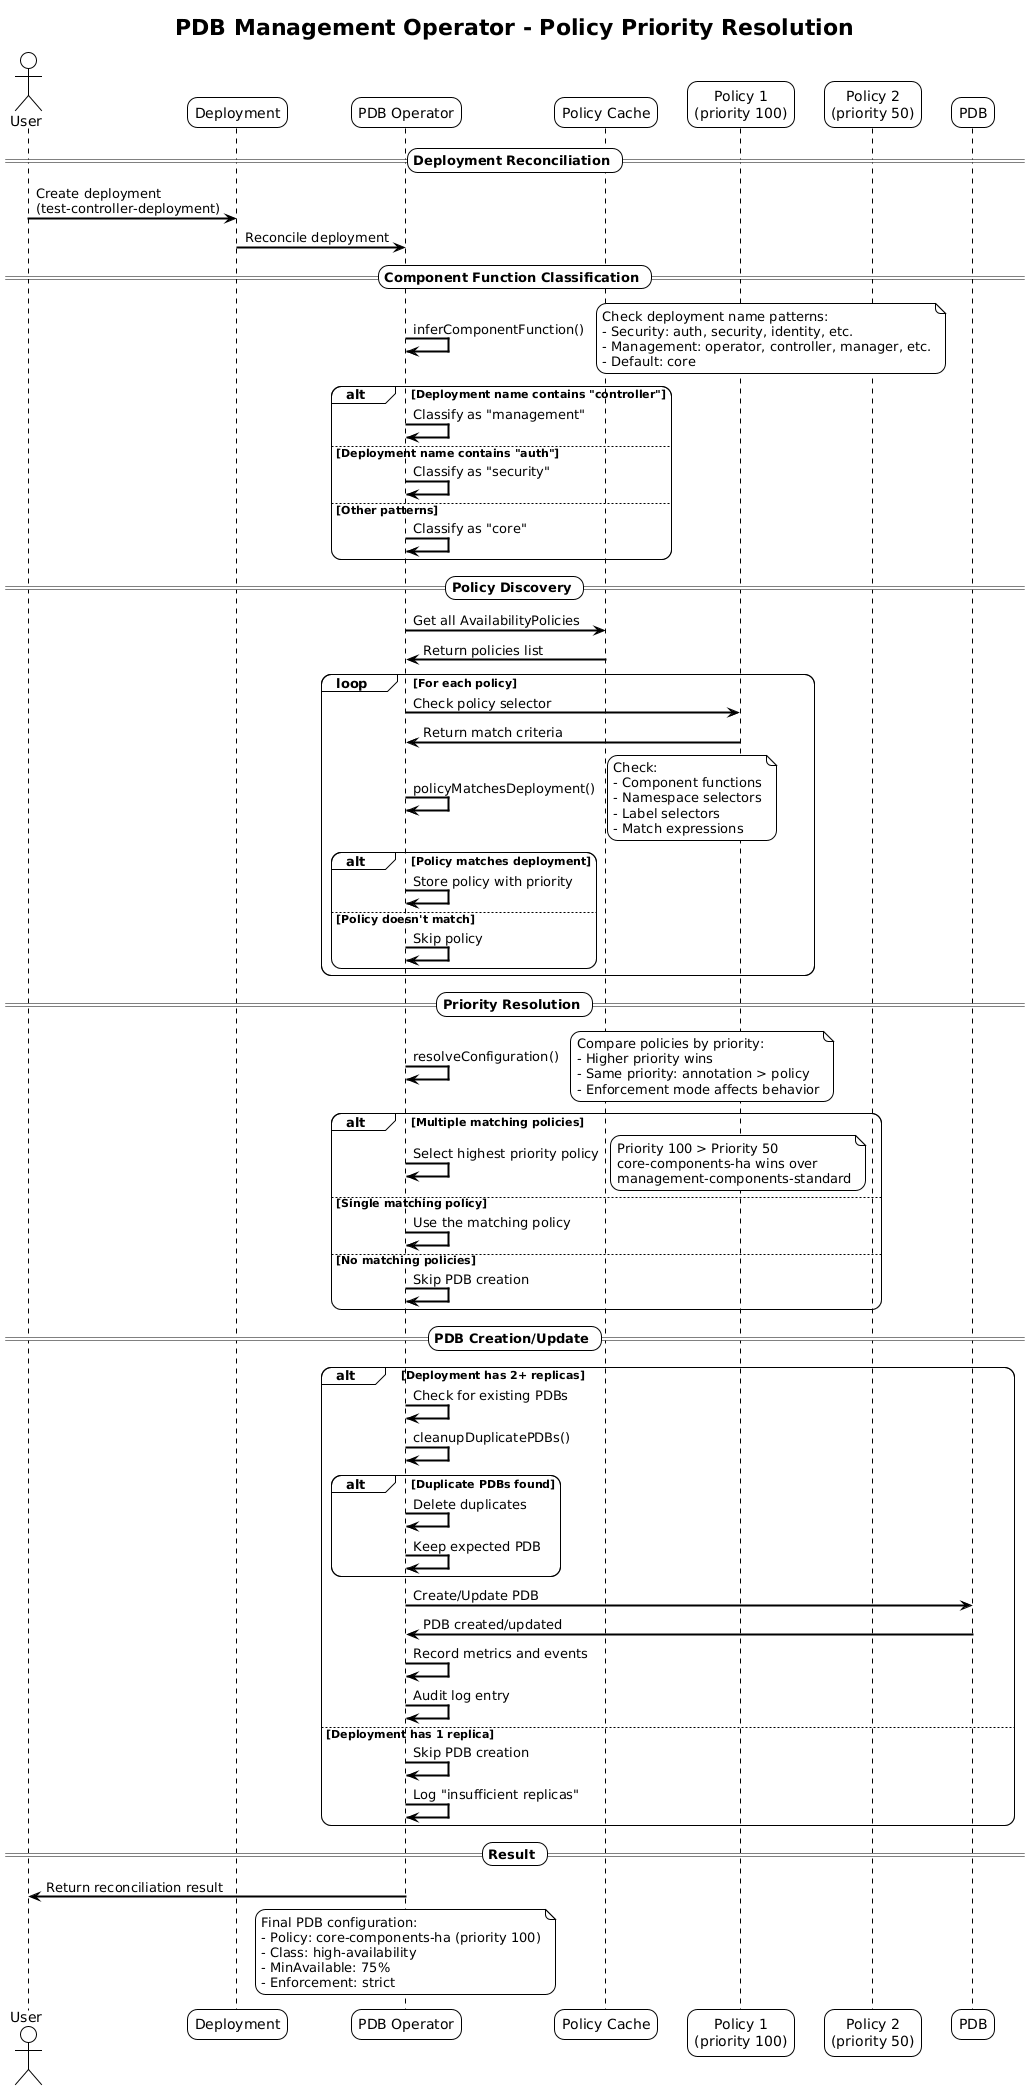
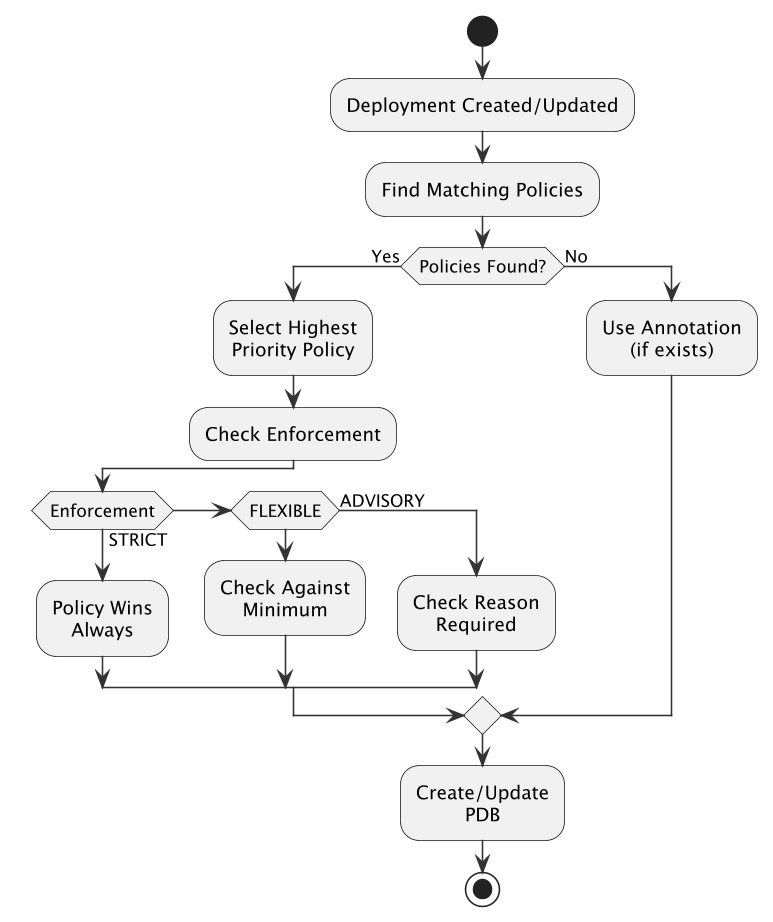
Priority Chain Example
# Highest priority - catches security components
- name: security-override
  priority: 1000
  componentSelector:
    componentFunctions: [security]

# Medium priority - catches production
- name: production-policy
  priority: 500
  componentSelector:
    matchLabels:
      environment: production

# Lowest priority - catch-all
- name: default-policy
  priority: 1
  componentSelector:
    matchLabels: {} # Matches everything
Policy Matching Logic
Namespace Filter (if specified)
Deployment must be in one of the listed namespaces
Component Name Match (if specified)
Checks
oda.tmforum.org/componentNameannotationFalls back to deployment name if annotation missing
Component Function Match (if specified)
Checks
oda.tmforum.org/component-functionannotationDefaults to “core” if not specified
Label Selector Match (if specified)
Standard Kubernetes label matching
Both matchLabels and matchExpressions supported
All specified criteria must match (AND logic).
Webhook Validation Rules
The admission webhook enforces these rules:
Availability Class Validation
Must be one of: non-critical, standard, high-availability, mission-critical, custom
Custom requires customPDBConfig
Custom PDB Config Validation
Must specify either minAvailable OR maxUnavailable (not both)
Values must be valid (percentage or number)
UnhealthyPodEvictionPolicy must be valid if specified
Component Selector Validation
At least one selection criterion required
Namespaces must be valid DNS names
Label keys/values must be valid
Maintenance Window Validation
Start/end times must be valid HH:MM format
Timezone must be valid IANA timezone
DaysOfWeek must be 0-6
Enforcement Configuration
MinimumClass only valid with flexible enforcement
MinimumClass must be valid availability class
Override settings ignored in strict mode
Audit Events
The operator generates events for policy decisions:
Events: Type     Reason                Age   From                    Message
  ----     ------                ----  ----                    --------
  Warning  PolicyEnforced        1m    pdb-management-operator Annotation override blocked by strict policy security-strict-policy
  Normal   AnnotationAccepted    30s   pdb-management-operator Annotation mission-critical meets minimum requirement standard
  Warning  BelowMinimum         15s   pdb-management-operator Annotation non-critical below minimum standard, using standard
  Normal   MaintenanceActive     5s    pdb-management-operator Entering maintenance window, PDB enforcement suspended
Migration Guide
From v1alpha to v1alpha1
Update CRD version:
# Old
apiVersion: pdb.oda.tmforum.org/v1alpha

# New
apiVersion: availability.oda.tmforum.org/v1alpha1
New enforcement field:
spec:
  enforcement: flexible # new field
  minimumClass: standard # new field for flexible mode
Enhanced webhook validation:
Automatic defaulting of maintenance window timezones
Validation of enforcement configurations
Warning generation for best practices
Internals
Caching Strategy
The operator uses a multi-level caching strategy:
Policy Cache: 5-minute TTL, 100 entry limit
Maintenance Window Cache: 1-minute TTL for active checks
Deployment State Cache: Tracks managed deployments
Circuit Breaker Implementation
// Per-operation circuit breakers
breakers := map[string]*gobreaker.CircuitBreaker{
    "create-pdb": newBreaker("create-pdb"),
    "update-pdb": newBreaker("update-pdb"),
    "delete-pdb": newBreaker("delete-pdb"),
}

// Configuration
Settings: gobreaker.Settings{
    Timeout: 30 * time.Second,
    ReadyToTrip: func(counts gobreaker.Counts) bool {
        failureRatio := float64(counts.TotalFailures) / float64(counts.Requests)
        return counts.Requests >= 3 && failureRatio >= 0.6
    },
}
Reconciliation Logic
Deployment Controller:
Processes deployment changes
Resolves configuration (annotation vs policy)
Applies enforcement logic
Creates/updates/deletes PDBs
AvailabilityPolicy Controller:
Processes policy changes
Triggers re-reconciliation of affected deployments
Updates policy metrics
Deployment Deletion Handling
When a deployment is deleted, the operator ensures proper cleanup of associated PDBs:
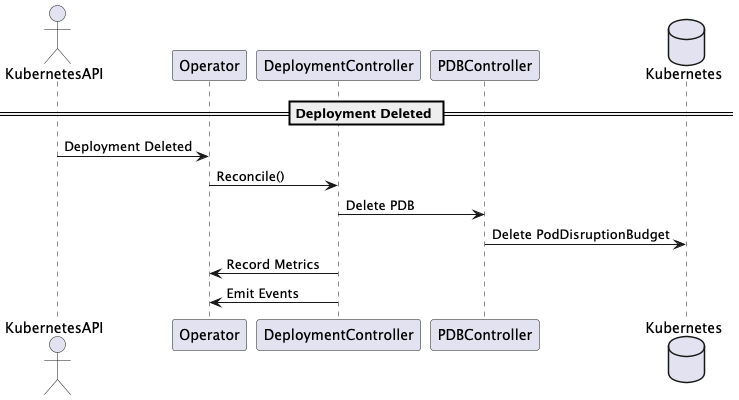
Monitoring & Observability
Key Metrics
# PDB lifecycle
pdb_management_pdbs_created_total{namespace, availability_class, component_function}
pdb_management_pdbs_updated_total{namespace, availability_class}
pdb_management_pdbs_deleted_total{namespace, reason}

# Performance
pdb_management_reconciliation_duration_seconds{controller, result}
pdb_management_reconciliation_errors_total{controller, error_type}

# Enforcement
pdb_management_enforcement_decisions_total{enforcement_mode, decision, namespace}
pdb_management_override_attempts_total{result, reason, namespace}
pdb_management_policy_conflicts_total{resolution, enforcement_mode, namespace}

# Cache
pdb_management_cache_hits_total{cache_type}
pdb_management_cache_misses_total{cache_type}

# Resources
pdb_management_deployments_managed{namespace, availability_class}
pdb_management_policies_active{namespace}
Grafana Dashboard
A comprehensive dashboard is available at dashboards/pdb-management.json featuring:
PDB lifecycle metrics
Enforcement decision breakdown
Cache performance
Error rates and types
Reconciliation performance
Unified Logging System
The operator implements a comprehensive unified logging system that provides structured, traceable logs with full observability and eliminates field duplication.
Architecture
The unified logging system consists of:
UnifiedLogEntry: Single struct for all log entries
UnifiedLogger: Centralized logger with context propagation
Trace Context: Automatic propagation of trace_id, span_id, correlationID
Structured Output: Consistent JSON format across all log types
Log Structure
All logs follow a consistent structure:
{
  "level": "info",
  "ts": "2025-07-06T09:50:22.454304592Z",
  "msg": "Starting reconciliation",
  "controller": {
    "type": "deployment-pdb",
    "name": "deployment-controller",
    "group": "apps",
    "kind": "Deployment"
  },
  "resource": {
    "type": "deployment",
    "name": "tmf620-productcatalog",
    "namespace": "components"
  },
  "reconcileID": "deployment-f959cd46-f5c8-497f-b84d-b6d0d0ce04a2",
  "correlationID": "b558f470-b55d-4af4-b9b4-b7a6043ce95f",
  "trace": {
    "trace_id": "2b4148def0c46c496b41c1ade1c7cc7f",
    "span_id": "55b5595fbf126025"
  },
  "details": {
    "availabilityClass": "high-availability",
    "source": "annotation-no-policy"
  }
}
Trace Context Fields
trace_id: OpenTelemetry trace identifier for distributed tracing
span_id: Current operation span identifier
correlationID: Business correlation identifier for request tracking
reconcileID: Kubernetes reconciliation identifier
Audit Logging
Audit logs include full trace context and structured details:
{
  "level": "info",
  "ts": "2025-07-06T09:50:22.457153467Z",
  "msg": "Audit log",
  "controller": {
    "type": "pdb-direct",
    "name": "pdb-direct-controller",
    "group": "apps",
    "kind": "Deployment"
  },
  "resource": {
    "type": "poddisruptionbudget",
    "name": "tmf620-productcatalog",
    "namespace": "components"
  },
  "reconcileID": "pdb-526803c1-b0b4-46ed-83e2-3a0357fdc594",
  "correlationID": "f7da36c6-716a-4e65-89b7-cb83476542fd",
  "trace": {
    "trace_id": "8e37377bd4ff755b7e21278e06bd73fd",
    "span_id": "450fe3d49c33229e"
  },
  "details": {
    "action": "CREATE",
    "availabilityClass": "high-availability",
    "correlationId": "",
    "maxUnavailable": null,
    "minAvailable": "75%",
    "name": "tmf620-productcatalog",
    "namespace": "components",
    "resource": "tmf620-productcatalog-pdb",
    "resourceType": "PodDisruptionBudget",
    "result": "SUCCESS",
    "timestamp": "2025-07-06T09:50:22Z"
  }
}
Implementation Details
The unified logging system is implemented in internal/logging/unified.go:
type UnifiedLogEntry struct {
    Level        string                 `json:"level"`
    Timestamp    time.Time              `json:"ts"`
    Message      string                 `json:"msg"`
    Controller   ControllerInfo         `json:"controller"`
    Resource     ResourceInfo           `json:"resource"`
    ReconcileID  string                 `json:"reconcileID"`
    CorrelationID string                `json:"correlationID"`
    Trace        TraceInfo              `json:"trace"`
    Details      map[string]interface{} `json:"details,omitempty"`
}

type UnifiedLogger struct {
    logger       logr.Logger
    context      context.Context
    controller   ControllerInfo
    resource     ResourceInfo
    reconcileID  string
    correlationID string
}
Context Propagation
The system automatically propagates trace context:
OpenTelemetry Integration: Automatic trace_id and span_id extraction
Correlation ID: Business correlation identifier for request tracking
Reconcile ID: Kubernetes reconciliation identifier
Controller Context: Controller type, name, group, and kind
Resource Context: Resource type, name, and namespace
Log Analysis
Advanced log analysis capabilities:
# Filter by trace ID for distributed tracing
kubectl logs -n canvas deployment/pdb-management-controller-manager | \
  jq 'select(.trace.trace_id == "2b4148def0c46c496b41c1ade1c7cc7f")'

# Find all audit logs for a specific resource
kubectl logs -n canvas deployment/pdb-management-controller-manager | \
  jq 'select(.msg == "Audit log" and .details.resource == "my-app-pdb")'

# Track complete reconciliation flow
kubectl logs -n canvas deployment/pdb-management-controller-manager | \
  jq 'select(.reconcileID == "deployment-f959cd46-f5c8-497f-b84d-b6d0d0ce04a2")'

# Analyze enforcement decisions
kubectl logs -n canvas deployment/pdb-management-controller-manager | \
  jq 'select(.details.enforcement) | .details'
Tracing
The operator supports OpenTelemetry tracing with full context propagation:
graph TD
    A[deployment-reconcile] --> B[get-deployment]
    A --> C[check-annotations]
    A --> D[lookup-policies]
    D --> E[cache-lookup]
    A --> F[resolve-configuration]
    F --> G[apply-enforcement]
    A --> H[manage-pdb]
    H --> I[get-existing-pdb]
    H --> J[create-or-update-pdb]
All trace spans include the unified logging context for complete observability.
Performance
Benchmarks
Tested with 200+ deployments:
Reconciliation time: < 100ms average
Cache hit rate: > 90%
Memory usage: < 100MB
CPU usage: < 100m
Optimization Techniques
Efficient watching: Predicate filters reduce unnecessary reconciliations
Batch processing: Groups related operations
Smart caching: TTL-based with size limits
Circuit breakers: Prevent cascade failures
Security
RBAC Configuration
Minimal required permissions:
- apiGroups: ["apps"]
  resources: ["deployments"]
  verbs: ["get", "list", "watch", "update", "patch"]

- apiGroups: ["policy"]
  resources: ["poddisruptionbudgets"]
  verbs: ["get", "list", "watch", "create", "update", "patch", "delete"]

- apiGroups: ["availability.oda.tmforum.org"]
  resources: ["availabilitypolicies"]
  verbs: ["get", "list", "watch"]
Security Features
Non-root execution: Runs as non-root user
Read-only filesystem: Except for temp directories
Dropped capabilities: All capabilities dropped
Network policies: Support for network isolation
Webhook authentication: Cert-based webhook auth
Pod Security Standards
Complies with Kubernetes restricted security standards:
runAsNonRoot: truereadOnlyRootFilesystem: trueallowPrivilegeEscalation: falseseccompProfile: RuntimeDefault
Troubleshooting
Common Issues
PDB Not Created
Check deployment annotations:
kubectl get deployment my-app -o jsonpath='{.metadata.annotations}'
Check operator logs:
kubectl logs -n canvas deployment/pdb-management-controller-manager
Policy Not Matching
Verify policy selector:
kubectl describe availabilitypolicy my-policy
Check deployment labels:
kubectl get deployment -l tier=frontend
Enforcement Not Working as Expected
Check policy enforcement mode:
kubectl get availabilitypolicy my-policy -o jsonpath='{.spec.enforcement}'
Review enforcement decisions in metrics:
curl http://operator-pod:8080/metrics | grep enforcement_decisions
Maintenance Window Issues
Verify timezone:
kubectl exec -n canvas deployment/pdb-management-controller-manager -- date
Check maintenance window configuration:
kubectl get availabilitypolicy my-policy -o jsonpath='{.spec.maintenanceWindows}'
High Memory Usage
Check cache statistics:
pdb_management_cache_hits_total
pdb_management_cache_misses_total
Review managed deployments:
kubectl get deployments -A -o json | jq '.items | length'
Debug Mode
Enable debug logging:
kubectl -n canvas set env deployment/pdb-management-controller-manager LOG_LEVEL=debug
Health Checks
# Liveness
curl http://operator-pod:8081/healthz

# Readiness
curl http://operator-pod:8081/readyz

# Metrics
curl http://operator-pod:8080/metrics