PDB Management Operator
Intelligent Pod Disruption Budget Management for ODA Canvas
The PDB Management Operator automatically creates and manages Pod Disruption Budgets (PDBs) for Kubernetes deployments based on availability requirements and component functions within the TM Forum Open Digital Architecture (ODA) Canvas.
Key Features
Automatic PDB Management: Creates PDBs based on deployment annotations
Policy-Based Configuration: Define organization-wide availability policies using CRDs
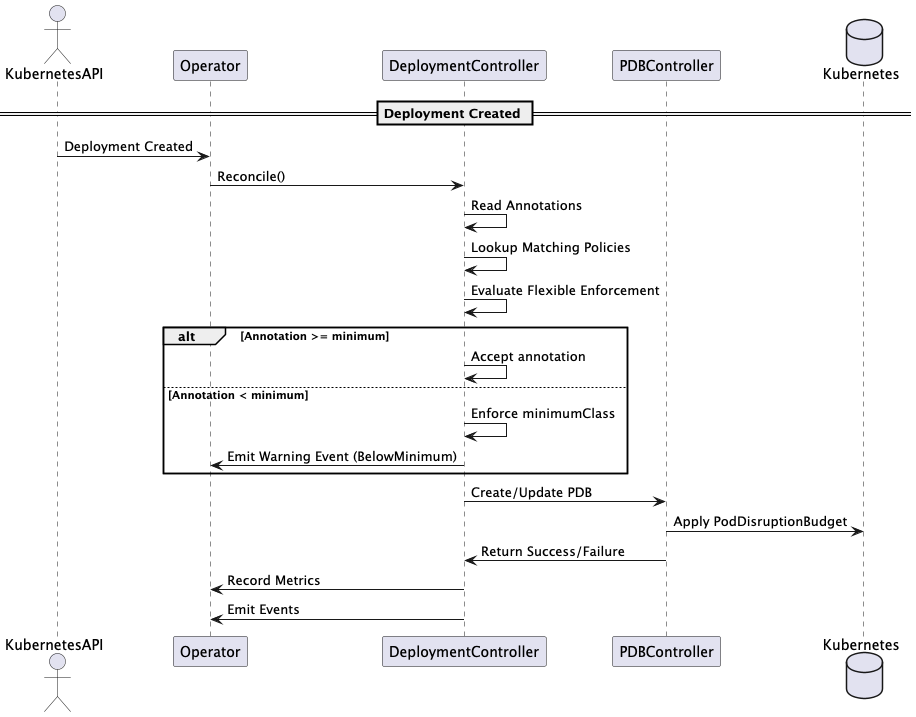
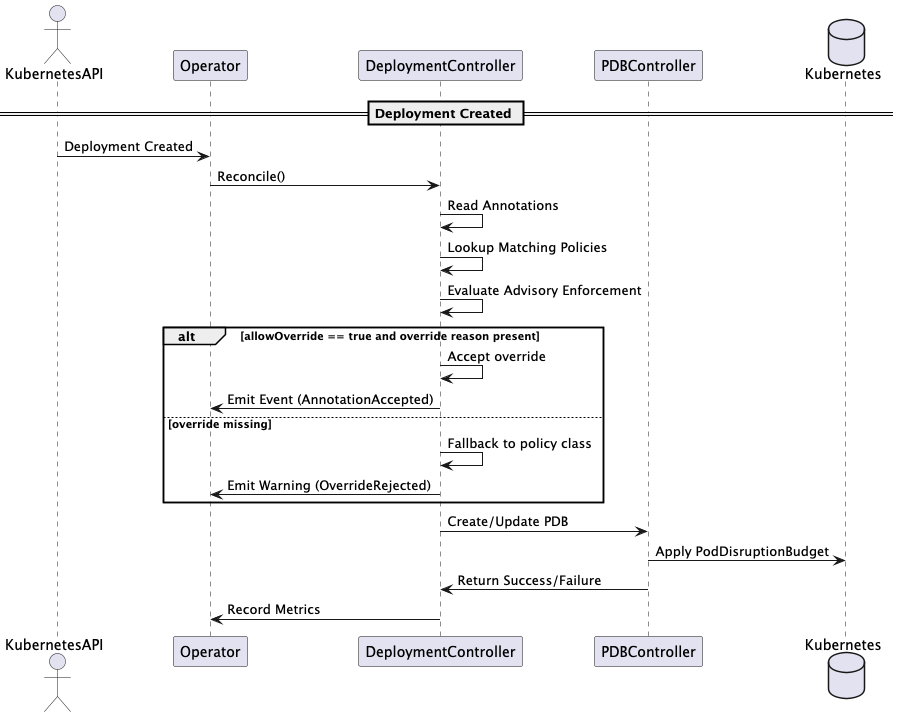
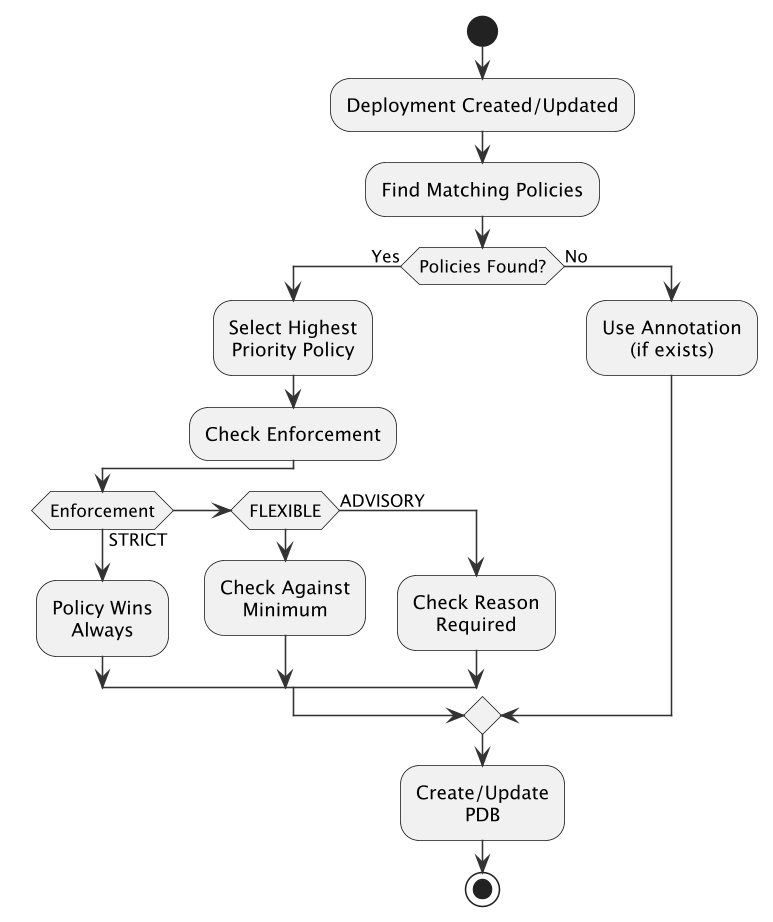
Flexible Enforcement Modes: Strict, Flexible, and Advisory policy enforcement
ODA Canvas Integration: Native support for TM Forum ODA component metadata
Intelligent Defaults: Component function-aware availability levels
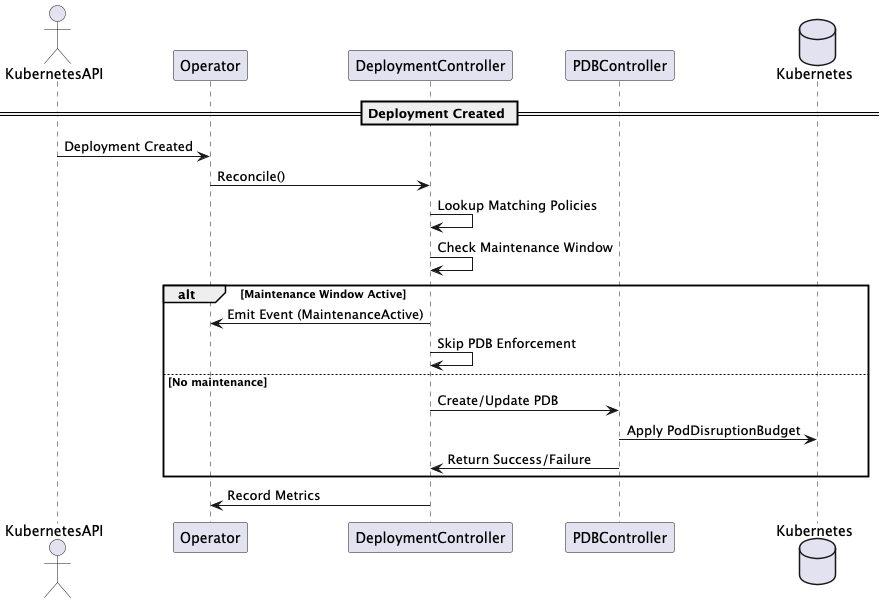
Maintenance Windows: Time-based PDB suspension for scheduled maintenance
AI-Powered Analysis: Integrated MCP server for cluster analysis and intelligent recommendations
High Performance: Optimized for 200+ deployments with intelligent caching
Comprehensive Observability: Built-in metrics, tracing, and audit logging
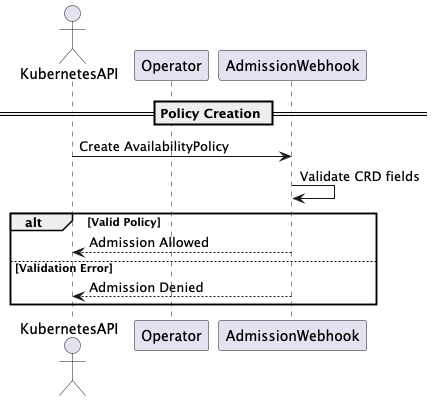
Admission Webhooks: Validate and default AvailabilityPolicy resources
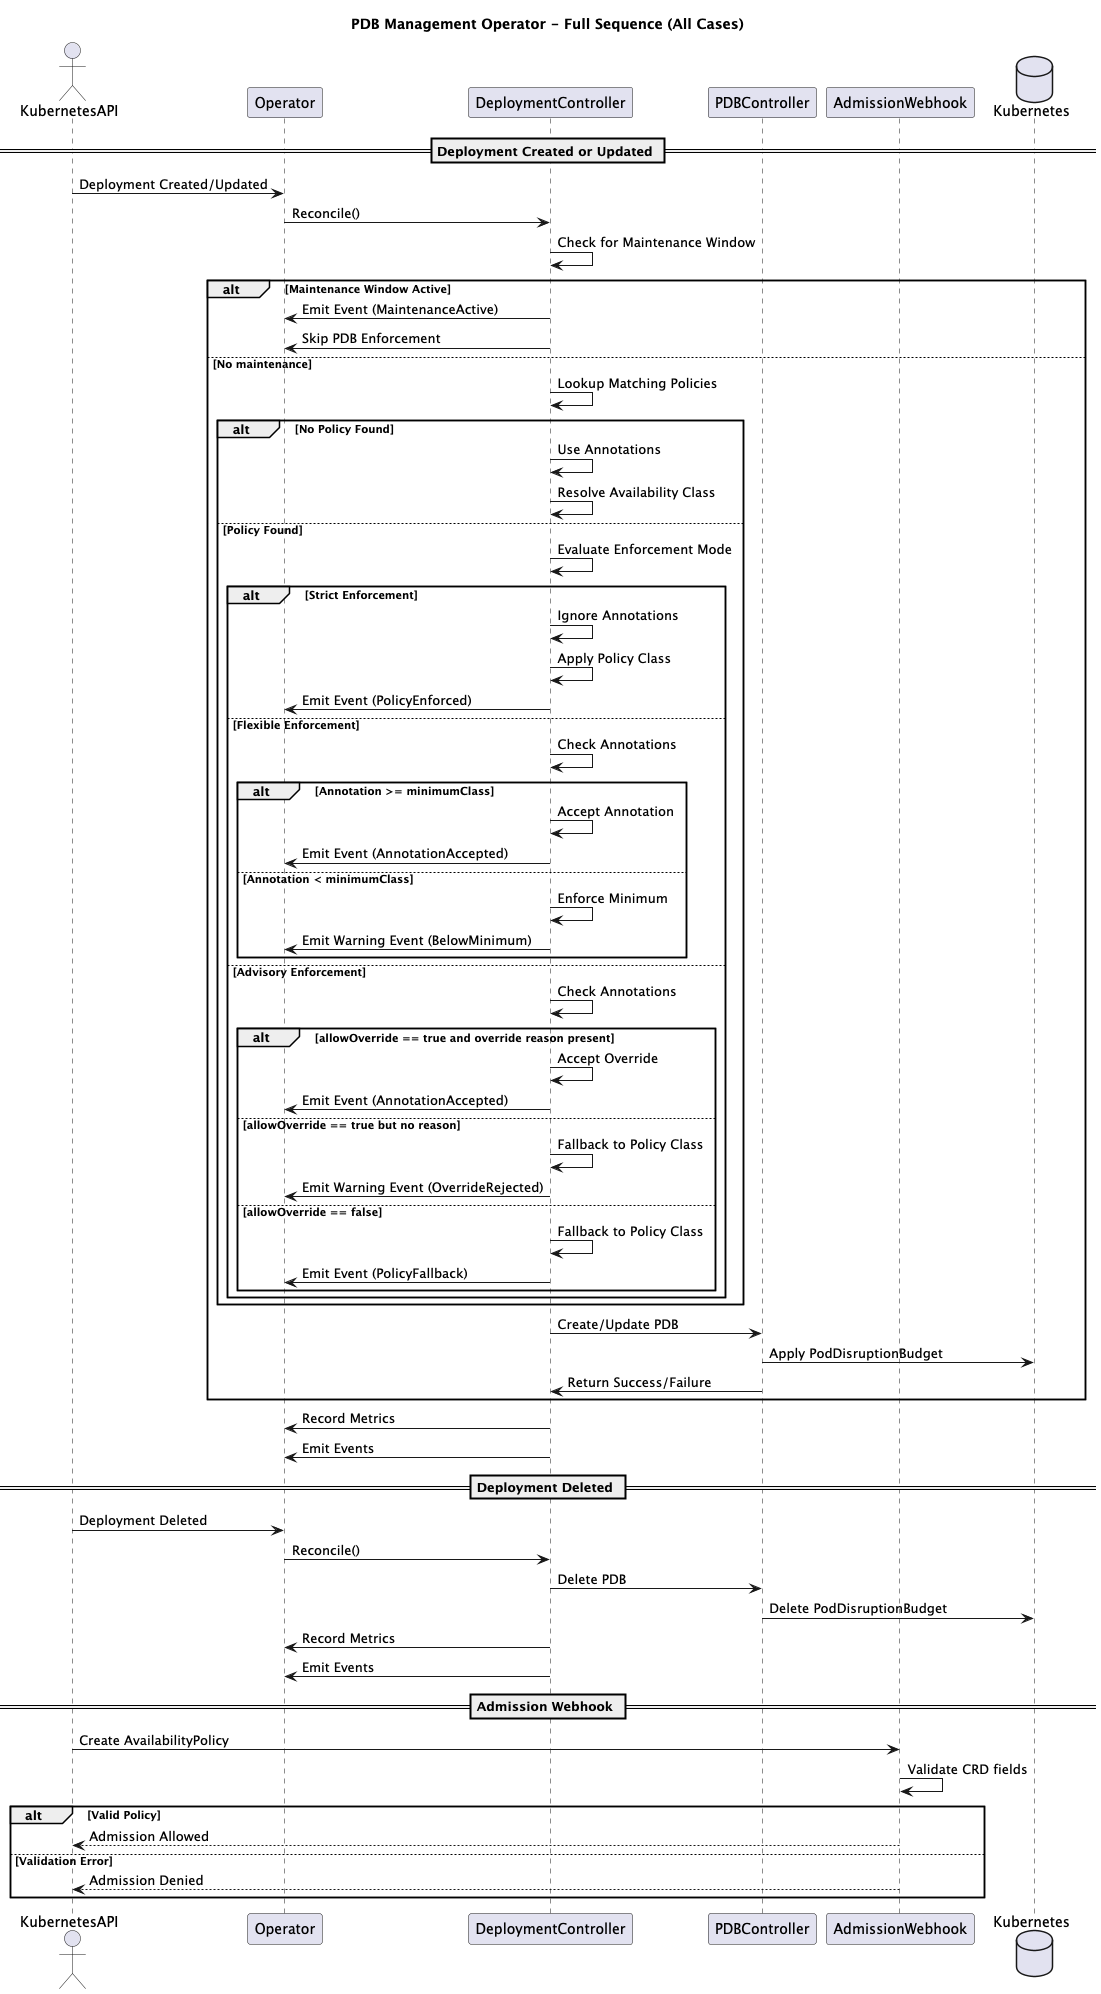
Architecture Overview
Quick Start
Basic Usage - Annotation Based
apiVersion: apps/v1
kind: Deployment
metadata:
  name: my-app
  annotations:
    oda.tmforum.org/availability-class: "high-availability"
    oda.tmforum.org/component-function: "core" # optional
spec:
  replicas: 3
  # ... rest of deployment spec
The operator will automatically create a PDB with appropriate settings:
kubectl get pdb my-app-pdb
# NAME         MIN AVAILABLE   MAX UNAVAILABLE   ALLOWED DISRUPTIONS   AGE
# my-app-pdb   75%            N/A               1                     5s
Policy-Based Configuration
For organization-wide policies, use the powerful AvailabilityPolicy CRD:
Example 1: Strict Enforcement for Critical Services
apiVersion: availability.oda.tmforum.org/v1alpha1
kind: AvailabilityPolicy
metadata:
  name: critical-services-strict
spec:
  availabilityClass: mission-critical
  enforcement: strict # No overrides allowed - policy always wins
  componentSelector:
    componentFunctions: [security]
    matchLabels:
      tier: critical
  priority: 1000 # Highest priority
Example 2: Flexible Enforcement with Minimum Standards
apiVersion: availability.oda.tmforum.org/v1alpha1
kind: AvailabilityPolicy
metadata:
  name: production-flexible
spec:
  availabilityClass: high-availability
  enforcement: flexible
  minimumClass: standard # Teams can increase but not go below standard
  componentSelector:
    matchLabels:
      environment: production
  maintenanceWindows:
    - start: "02:00"
      end: "04:00"
      timezone: "UTC"
      daysOfWeek: [0, 6] # weekends
  priority: 500
Example 3: Advisory with Override Controls
apiVersion: availability.oda.tmforum.org/v1alpha1
kind: AvailabilityPolicy
metadata:
  name: development-advisory
spec:
  availabilityClass: standard
  enforcement: advisory
  allowOverride: true
  overrideRequiresReason: true # Must provide reason in annotation
  componentSelector:
    matchLabels:
      environment: development
  priority: 100
Availability Classes
Class |
Core/Mgmt |
Security |
Description |
Use Cases |
|---|---|---|---|---|
|
20% |
50%* |
Non-critical workloads |
Dev/test, batch jobs |
|
50% |
75%* |
Typical services |
Microservices, APIs |
|
75% |
75% |
Important services |
Core business logic |
|
90% |
90% |
Critical services |
Payment, authentication |
|
User-defined |
User-defined |
Custom requirements |
Special cases |
*Security components are automatically promoted to higher availability levels
Configuration
The operator supports extensive configuration via CLI flags:
# Cache configuration
--policy-cache-ttl=5m              # TTL for cached policies
--policy-cache-size=100            # Maximum policies to cache
--maintenance-window-cache-ttl=1m  # TTL for maintenance window cache

# Retry configuration
--retry-max-attempts=5             # Maximum retry attempts
--retry-initial-delay=100ms        # Initial retry delay
--retry-max-delay=30s              # Maximum retry delay
--retry-backoff-factor=2.0         # Backoff multiplier

# Webhook (gracefully degrades if cert-manager unavailable)
--enable-webhook=true              # Enable admission webhooks
See Performance and Caching for detailed tuning guidance.
Advanced Features
Enforcement Modes
The operator supports three enforcement modes for policies:
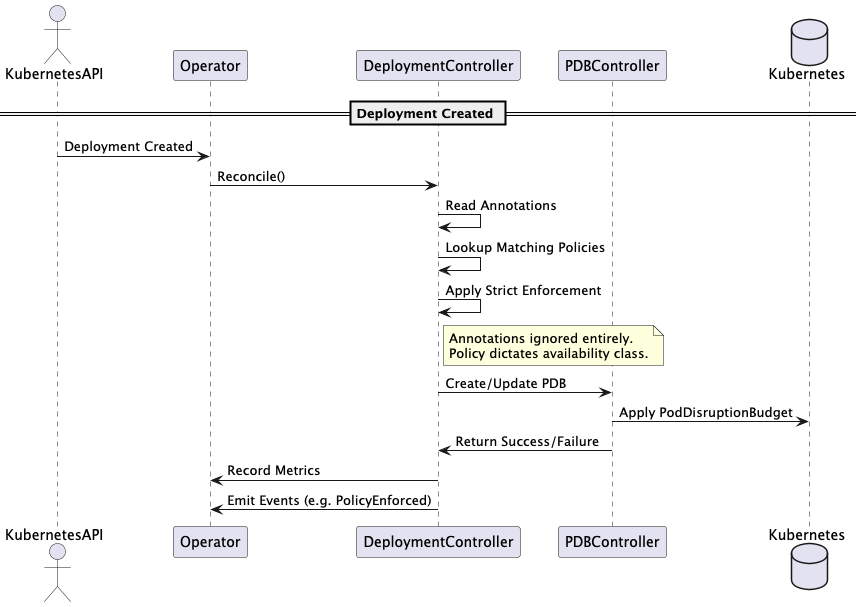
Strict: Policy always wins, annotations are ignored
Use for: Compliance requirements, critical infrastructure
Example: Security components must be mission-critical
Flexible: Annotations accepted if they meet minimum requirements
Use for: Allowing teams to opt for higher availability
Example: Production can be standard or higher
Advisory: Annotations preferred, policy as fallback
Use for: Development environments, recommendations
Example: Suggest standard but allow overrides
Advanced Policy Features
Override Controls
Control how deployments can override policy settings:
spec:
  enforcement: advisory
  allowOverride: true # Allow annotation overrides
  overrideRequiresReason: true # Require reason annotation
When overrideRequiresReason is true, deployments must include:
annotations:
  oda.tmforum.org/availability-class: "non-critical"
  oda.tmforum.org/override-reason: "Development testing only"
Custom PDB Configurations
Define custom availability classes with specific PDB settings:
apiVersion: availability.oda.tmforum.org/v1alpha1
kind: AvailabilityPolicy
metadata:
  name: custom-database-policy
spec:
  availabilityClass: custom
  customPDBConfig:
    minAvailable: 2 # Absolute number instead of percentage
    unhealthyPodEvictionPolicy: "AlwaysAllow" # Even unhealthy pods
  componentSelector:
    matchLabels:
      type: database
Multi-Criteria Selection
Policies can use multiple selection criteria:
componentSelector:
  namespaces: [prod, staging] # Specific namespaces
  componentNames: [api-gateway] # Specific components
  componentFunctions: [core, security] # Component functions
  matchLabels: # Label selectors
    tier: critical
  matchExpressions: # Complex selectors
    - key: region
      operator: In
      values: [us-east, eu-west]
Component Function Intelligence
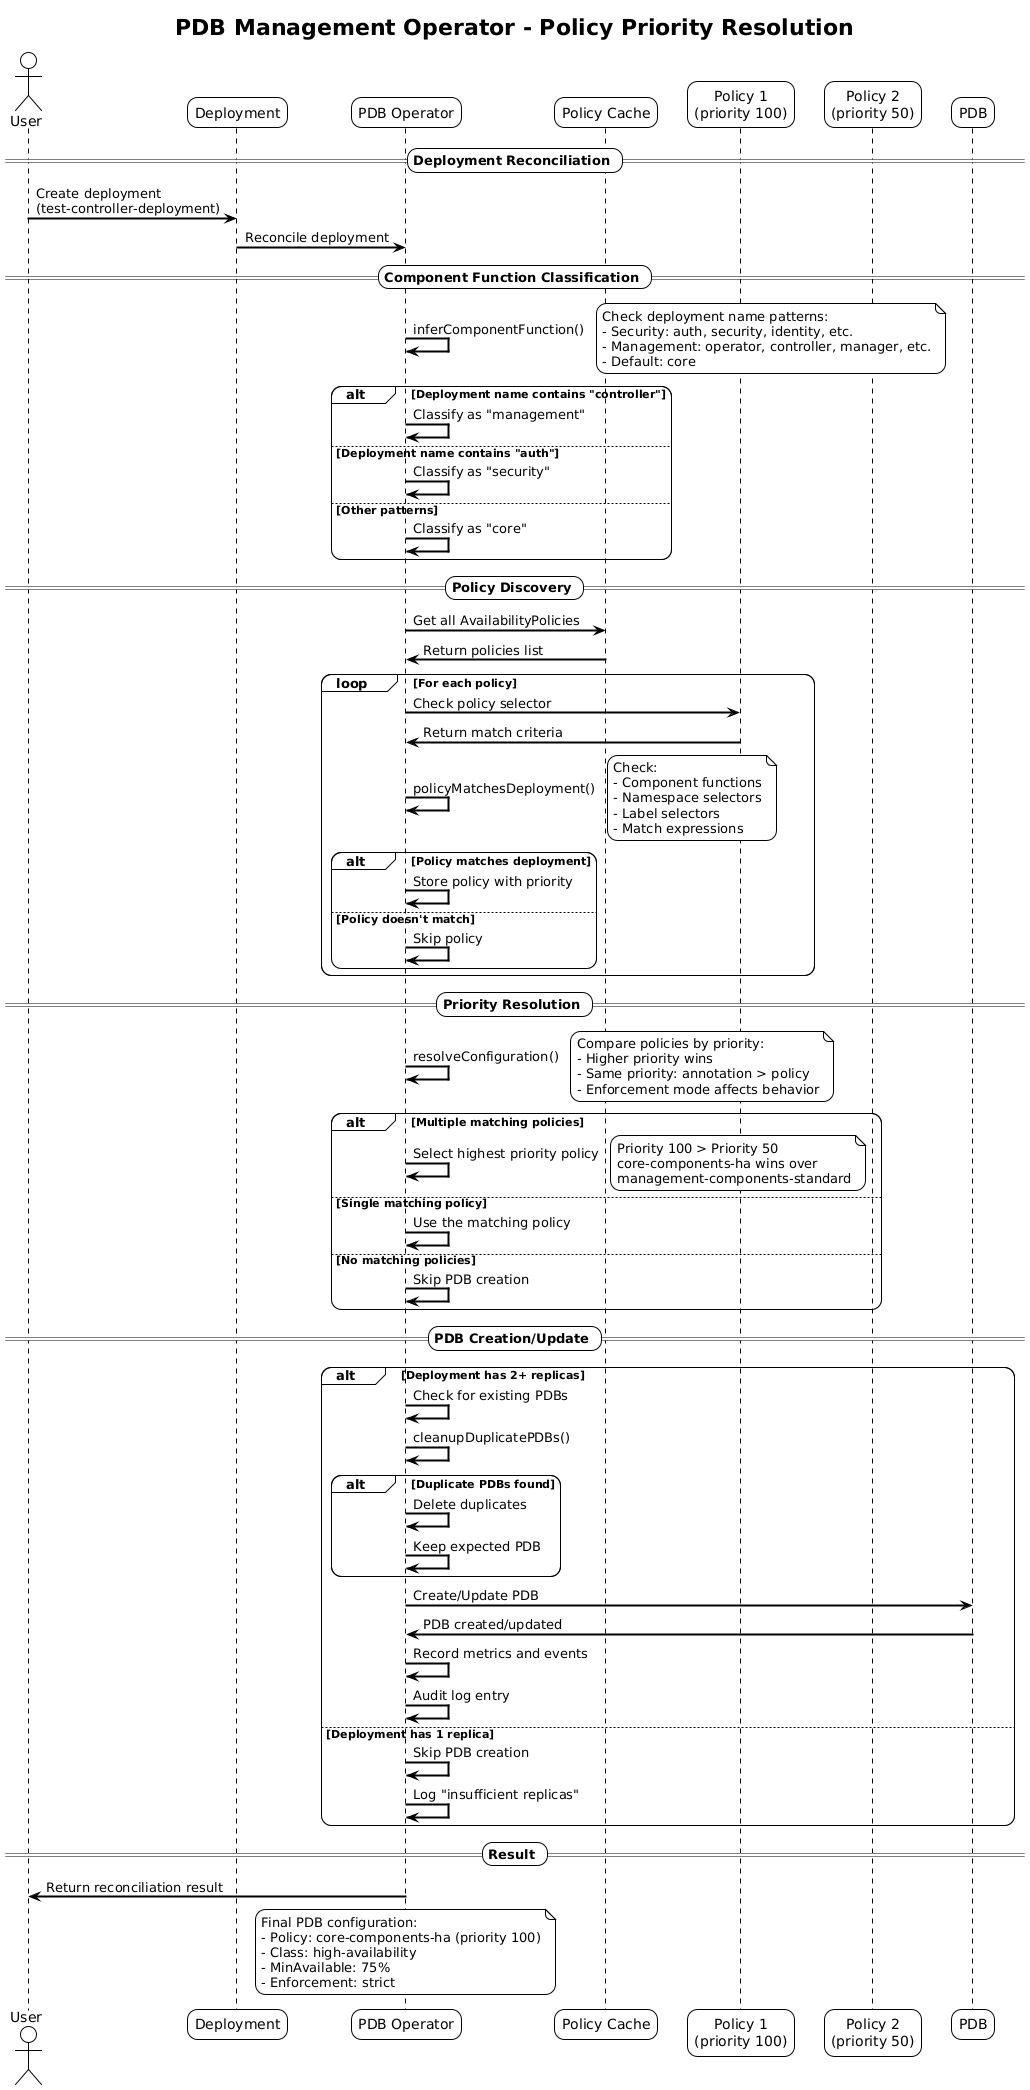
The operator automatically adjusts availability based on component function:
Security Components: Auto-upgrade to ensure higher availability
Core Components: Use standard availability mappings
Management Components: Standard behavior with configurable overrides
Maintenance Windows
Configure maintenance windows to temporarily suspend PDB enforcement:
annotations:
  oda.tmforum.org/maintenance-window: "02:00-04:00 UTC"
Or via policy:
maintenanceWindows:
  - start: "02:00"
    end: "04:00"
    timezone: "UTC"
    daysOfWeek: [1, 2, 3, 4, 5] # weekdays only
Custom Availability Configurations
Define custom availability classes via environment variable:
AVAILABILITY_CONFIGS='{
  "ultra-critical": {
    "minAvailable": "95%",
    "description": "Ultra critical services"
  }
}'
Monitoring & Observability
Key Metrics
Core Metrics
pdb_management_pdbs_created_total- Total PDBs createdpdb_management_pdbs_updated_total- Total PDBs updatedpdb_management_reconciliation_duration_seconds- Reconciliation performancepdb_management_enforcement_decisions_total- Policy enforcement decisionspdb_management_cache_hits_total- Cache efficiency metrics
Multi-Policy Resolution
pdb_management_multi_policy_matches_total- Times multiple policies matched a deploymentpdb_management_policy_tie_breaks_total- Policy tie-break resolutions
Retry Operations
pdb_management_retry_attempts_total- Retry attempts by operation and error typepdb_management_retry_exhausted_total- Operations that exhausted all retriespdb_management_retry_success_after_retry_total- Successful operations after retry
Webhook Status
pdb_management_webhook_status- Current webhook state (enabled/disabled/failed)
Health Checks
# Liveness probe
curl http://operator-pod:8081/healthz

# Readiness probe
curl http://operator-pod:8081/readyz

# Metrics endpoint
curl http://operator-pod:8080/metrics
Unified Logging System
The operator implements a comprehensive unified logging system that provides structured, traceable logs with full observability:
Structured JSON Logging
All logs are emitted in structured JSON format with consistent fields:
{
  "level": "info",
  "ts": "2025-07-06T09:50:22.454304592Z",
  "msg": "Starting reconciliation",
  "controller": {
    "type": "deployment-pdb",
    "name": "deployment-controller",
    "group": "apps",
    "kind": "Deployment"
  },
  "resource": {
    "type": "deployment",
    "name": "tmf620-productcatalog",
    "namespace": "components"
  },
  "reconcileID": "deployment-f959cd46-f5c8-497f-b84d-b6d0d0ce04a2",
  "correlationID": "b558f470-b55d-4af4-b9b4-b7a6043ce95f",
  "trace": {
    "trace_id": "2b4148def0c46c496b41c1ade1c7cc7f",
    "span_id": "55b5595fbf126025"
  },
  "details": {
    "availabilityClass": "high-availability",
    "source": "annotation-no-policy"
  }
}
Trace Context Propagation
Every log entry includes full trace context for distributed tracing:
trace_id: Unique identifier for the entire request flow
span_id: Identifier for the current operation span
correlationID: Business correlation identifier
reconcileID: Kubernetes reconciliation identifier
Audit Logging
The operator provides comprehensive audit logging for compliance with full trace context:
{
  "level": "info",
  "ts": "2025-07-06T09:50:22.457153467Z",
  "msg": "Audit log",
  "controller": {
    "type": "pdb-direct",
    "name": "pdb-direct-controller",
    "group": "apps",
    "kind": "Deployment"
  },
  "resource": {
    "type": "poddisruptionbudget",
    "name": "tmf620-productcatalog",
    "namespace": "components"
  },
  "reconcileID": "pdb-526803c1-b0b4-46ed-83e2-3a0357fdc594",
  "correlationID": "f7da36c6-716a-4e65-89b7-cb83476542fd",
  "trace": {
    "trace_id": "8e37377bd4ff755b7e21278e06bd73fd",
    "span_id": "450fe3d49c33229e"
  },
  "details": {
    "action": "CREATE",
    "availabilityClass": "high-availability",
    "correlationId": "",
    "maxUnavailable": null,
    "minAvailable": "75%",
    "name": "tmf620-productcatalog",
    "namespace": "components",
    "resource": "tmf620-productcatalog-pdb",
    "resourceType": "PodDisruptionBudget",
    "result": "SUCCESS",
    "timestamp": "2025-07-06T09:50:22Z"
  }
}
Log Levels and Filtering
The operator supports configurable log levels:
# Set log level via environment variable
kubectl set env deployment/pdb-management-controller-manager \
  -n canvas LOG_LEVEL=debug

# Available levels: debug, info, warn, error
Log Analysis
Use structured logging for advanced analysis:
# Filter logs by trace ID
kubectl logs -n canvas deployment/pdb-management-controller-manager | \
  jq 'select(.trace.trace_id == "2b4148def0c46c496b41c1ade1c7cc7f")'

# Find all audit logs for a specific resource
kubectl logs -n canvas deployment/pdb-management-controller-manager | \
  jq 'select(.msg == "Audit log" and .details.resource == "my-app-pdb")'

# Track reconciliation flow
kubectl logs -n canvas deployment/pdb-management-controller-manager | \
  jq 'select(.reconcileID == "deployment-f959cd46-f5c8-497f-b84d-b6d0d0ce04a2")'
Security
RBAC: Minimal required permissions (principle of least privilege)
Pod Security Standards: Runs as non-root with read-only filesystem
Network Policies: Support for network isolation
Webhook Security: Certificate-based authentication for admission webhooks
Troubleshooting
Common Issues
PDBs not being created?
# Check operator logs
kubectl -n canvas logs deployment/pdb-management-controller-manager

# Verify annotations
kubectl get deployment my-app -o jsonpath='{.metadata.annotations}'

# Check if PDB management is enabled
kubectl -n canvas get deployment pdb-management-controller-manager -o yaml | grep ENABLE_PDB
Policy not matching deployments?
# List all policies
kubectl get availabilitypolicies -A

# Check policy details
kubectl describe availabilitypolicy production-policy

# Verify deployment labels match selector
kubectl get deployment my-app --show-labels
Performance issues?
# Check cache metrics
curl http://operator-pod:8080/metrics | grep cache

# Enable debug logging
kubectl set env deployment/pdb-management-controller-manager \
  -n canvas LOG_LEVEL=debug
Documentation
Technical Documentation - Architecture and internals
MCP Integration - AI-powered analysis via Model Context Protocol
Performance and Caching - Performance optimization and caching strategies
Webhook Deployment - Admission webhook setup
Operational Runbook - Operations and troubleshooting guide
Verification Guide - Testing and validation
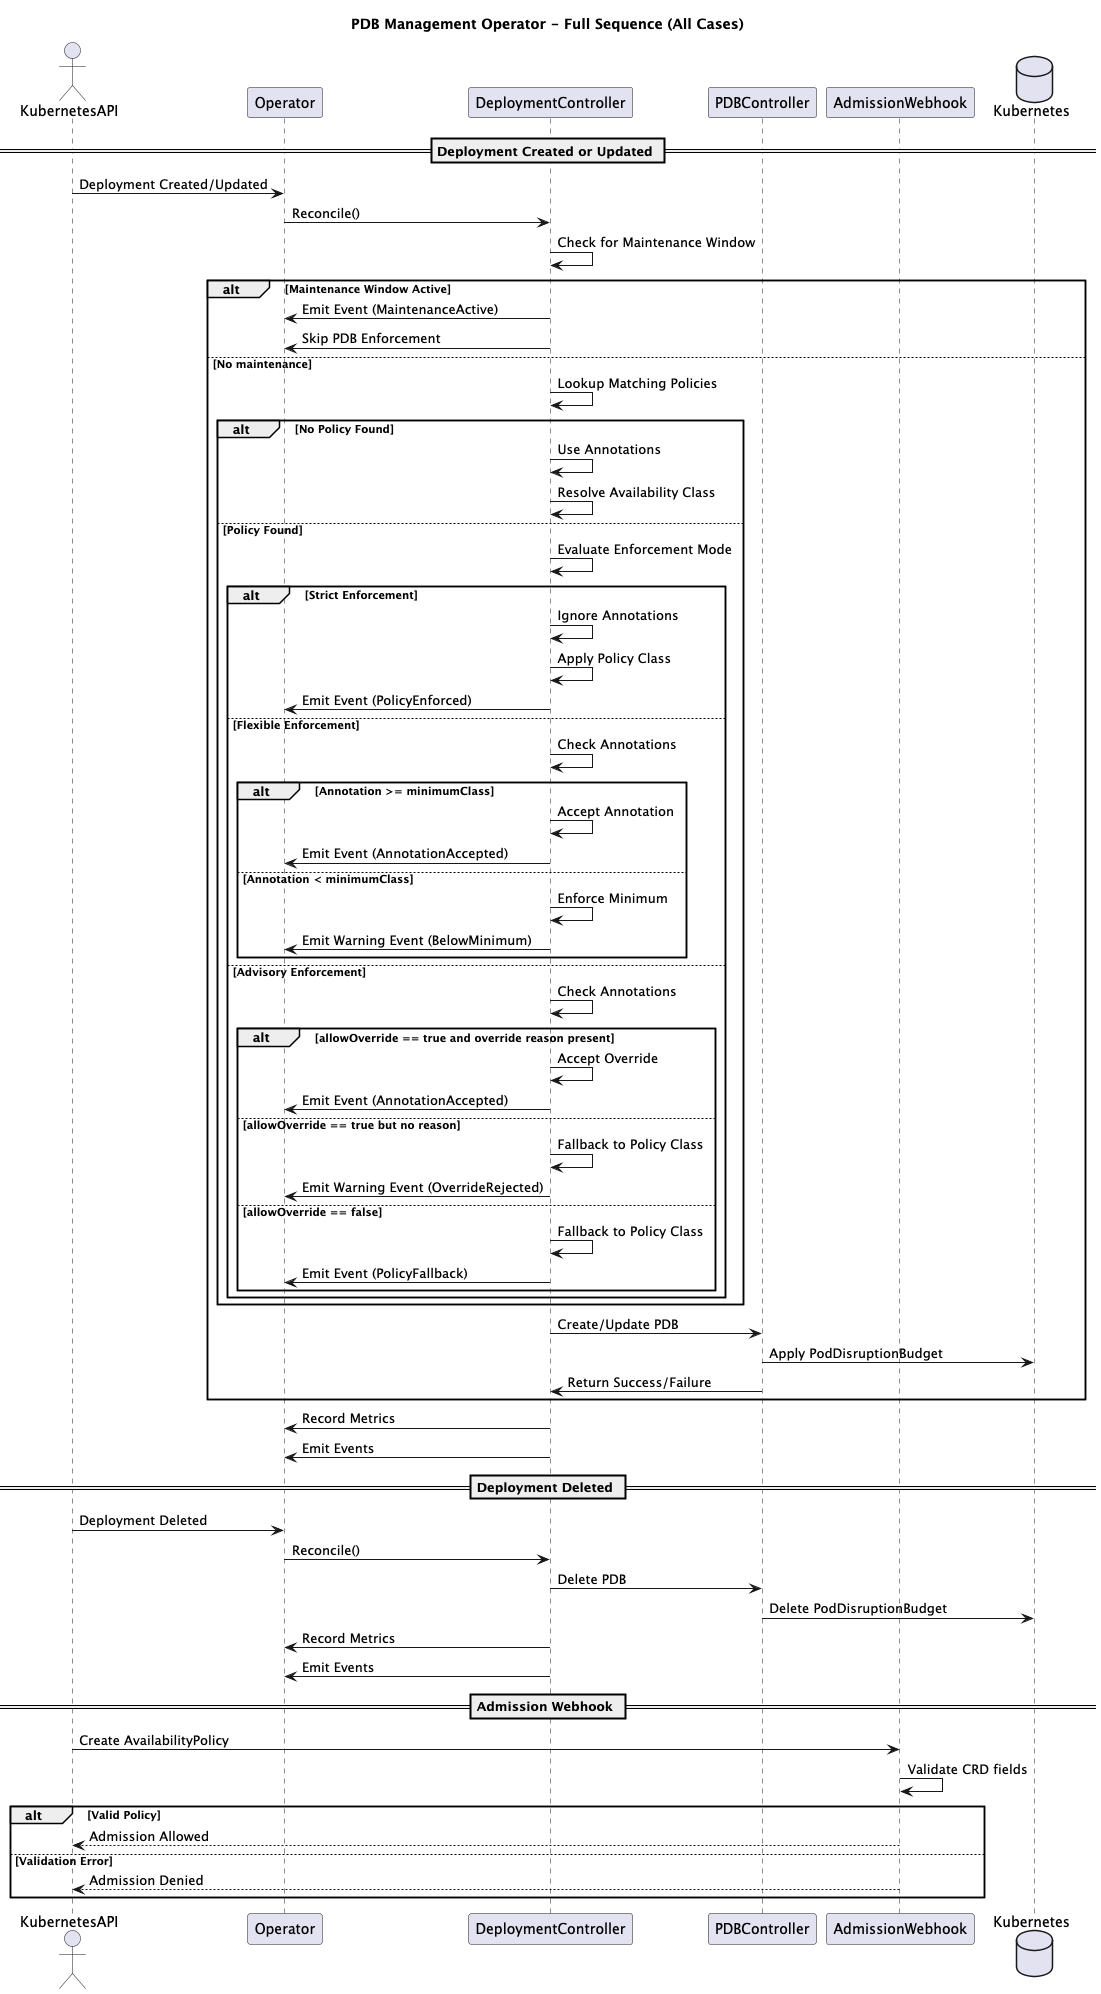
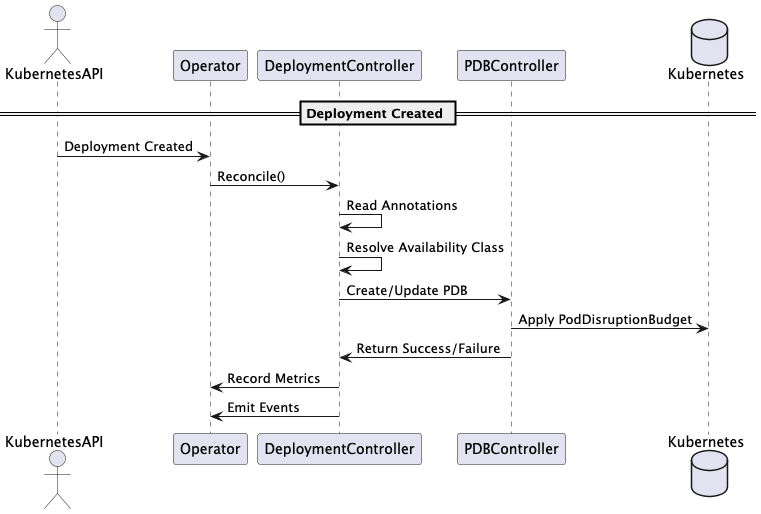
Diagrams
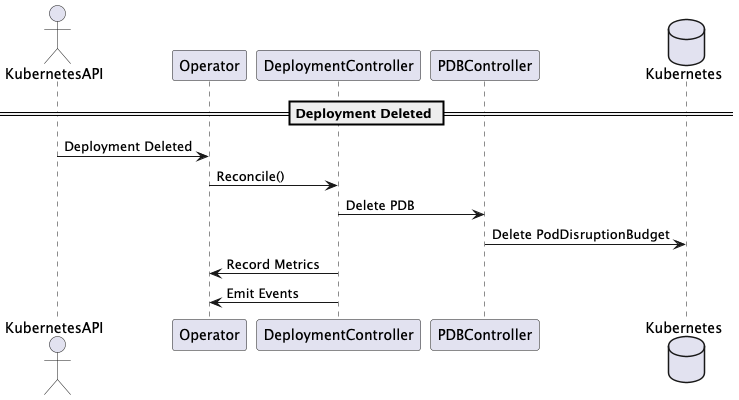
All architecture and sequence diagrams are available in the diagrams directory:
Diagram |
Description |
|---|---|
Full reconciliation sequence |
|
Annotation-based PDB creation flow |
|
Strict enforcement mode |
|
Flexible enforcement mode |
|
Advisory mode with overrides |
|
Policy priority resolution |
|
Conflict resolution logic |
|
Maintenance window handling |
|
Webhook validation flow |
|
Deployment deletion cleanup |
Contributing
This operator is part of the TM Forum ODA Canvas project. We welcome contributions!