ODA Canvas Observability Stack
Watch: Part 5, Observability in the ODA Canvas
A 9:44 video in the ODA Canvas training series. Watch it with chapters and a transcript, or on YouTube.
This Helm chart deploys a complete open-source observability stack for the TM Forum ODA Canvas, providing monitoring, alerting, and distributed tracing capabilities for ODA Components.
The observability stack installs ServiceMonitor resources for the OpenMetrics configuration. To configure the Canvas to use ServiceMonitor, set the openMetricsImplementation to ServiceMonitor. e.g. for the Istio API Operator option, use:
helm upgrade --install canvas charts/canvas-oda -n canvas --set api-operator-istio.deployment.openMetricsImplementation=ServiceMonitor --create-namespace
Chart-of-Charts
This chart-of-charts includes:
Prometheus: Metrics collection and storage
Grafana: Visualization and dashboards
Jaeger: Distributed tracing
OpenTelemetry Collector: Telemetry data processing and forwarding
Prerequisites
Kubernetes 1.19+
Helm 3.0+
At least 4GB of available memory for the observability stack
Installation
Quick Start
# Add the required Helm repositories
helm repo add prometheus-community https://prometheus-community.github.io/helm-charts
helm repo add opentelemetry https://open-telemetry.github.io/opentelemetry-helm-charts
helm repo add jaegertracing https://jaegertracing.github.io/helm-charts
helm repo update

# Install the observability stack
cd /charts
helm dependency build observability-stack
helm install observability ./observability-stack --create-namespace --namespace monitoring
Custom Installation
# Install with custom values
helm install observability ./observability-stack \
  --create-namespace \
  --namespace monitoring \
  --values my-values.yaml
Configuration
The following table lists the configurable parameters and their default values:
Parameter |
Description |
Default |
|---|---|---|
|
Namespace for observability components |
|
|
Enable Prometheus and Grafana |
|
|
Enable OpenTelemetry Collector |
|
|
Enable Jaeger |
|
|
Metrics retention period |
|
|
Grafana admin password |
|
|
Jaeger configuration arguments |
Memory storage with 50000 traces |
For Grafana, if no password is set, it will default to prom-operator.
Accessing the Services
Prometheus
kubectl port-forward svc/observability-prometheus-prometheus 9090:9090 -n monitoring
Visit: http://localhost:9090
Grafana
kubectl port-forward svc/observability-grafana 3000:80 -n monitoring
Visit: http://localhost:3000
Get admin password:
kubectl get secret observability-grafana -n monitoring -o jsonpath="{.data.admin-password}" | base64 -d
Jaeger
kubectl port-forward svc/observability-jaeger-query 16686:16686 -n monitoring
Visit: http://localhost:16686
BDD Testing
The Usecase UC012 contains feature tests for the observability. For the tests to work, you need to port-forward the observability-opentelemetry-collector deployment.
kubectl port-forward -n monitoring deployment/observability-opentelemetry-collector 8888:8888
ODA Component Integration
Metrics Collection
When you install a component with a openmetrics ExposedAPI, the Canvas will configure whatever Observability services you have installed. The reference implementation using Prometheus, Grafana, Jaeger amd OpenTelemetry Collector will create a ServiceMonitor resource in your component namespace. Something like:
apiVersion: monitoring.coreos.com/v1
kind: ServiceMonitor
metadata:
  name: my-component-metrics
  namespace: components
spec:
  selector:
    matchLabels:
      app: my-component
  endpoints:
  - port: metrics
    path: /metrics
    interval: 30s
Distributed Tracing
Configure your ODA Component with these environment variables:
env:
- name: OTEL_EXPORTER_OTLP_ENDPOINT
  value: "http://observability-opentelemetry-collector.monitoring.svc.cluster.local:4318/v1/traces"
- name: OTEL_RESOURCE_ATTRIBUTES
  value: "service.name=my-component"
Storage Considerations
This chart uses in-memory storage for Jaeger and default storage for Prometheus. For production deployments, consider:
Configuring persistent storage for Prometheus
Using external storage backends for Jaeger (Elasticsearch, Cassandra)
Implementing proper backup strategies
Scaling
To scale the observability stack:
Prometheus: Configure multiple replicas and sharding
Grafana: Configure multiple replicas behind a load balancer
Jaeger: Switch to distributed deployment with external storage
OpenTelemetry: Scale the collector as a DaemonSet or increase replicas
Troubleshooting
Common Issues
Pods stuck in Pending state: Check resource requirements and node capacity
Metrics not appearing: Verify ServiceMonitor labels and selectors
Traces not showing: Check OpenTelemetry collector logs and endpoint configuration
Useful Commands
# Check all pods
kubectl get pods -n monitoring

# Check services
kubectl get svc -n monitoring

# Check ServiceMonitor resources
kubectl get servicemonitor -A

# View logs
kubectl logs -n monitoring deployment/observability-opentelemetry-collector
Uninstallation
helm uninstall observability -n monitoring
kubectl delete namespace monitoring
Demonstration
Using the example Product Catalog component, you can observe the metrics and telemetry as follows:
Open-Metrics
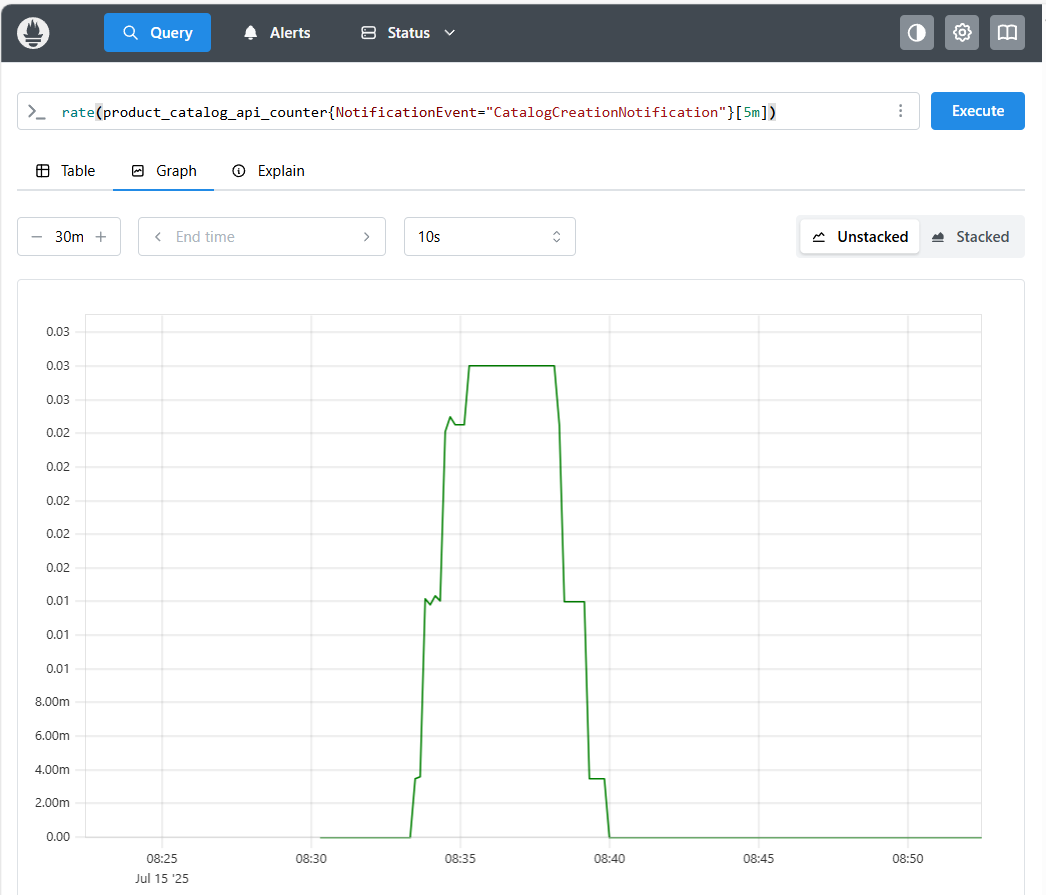
The example component implements an optional metrics API supporting the open metrics standard (formerly the prometheus de-facto standard). This metrics endpoint provides business metrics about all the Create/Update/Delete events for all the Product Catalog resources (Catalog, Category, Product Offering, Product Offering Price, Product Specification).
The observability-stack includes a Prometheus observability service that can scrape the metrics API and report on these business events. For example the screenshot below shows a graph of the rate of Catalog Create events with the query rate(product_catalog_api_counter{NotificationEvent="CatalogCreationNotification"}[5m]).
Open-Telemetry
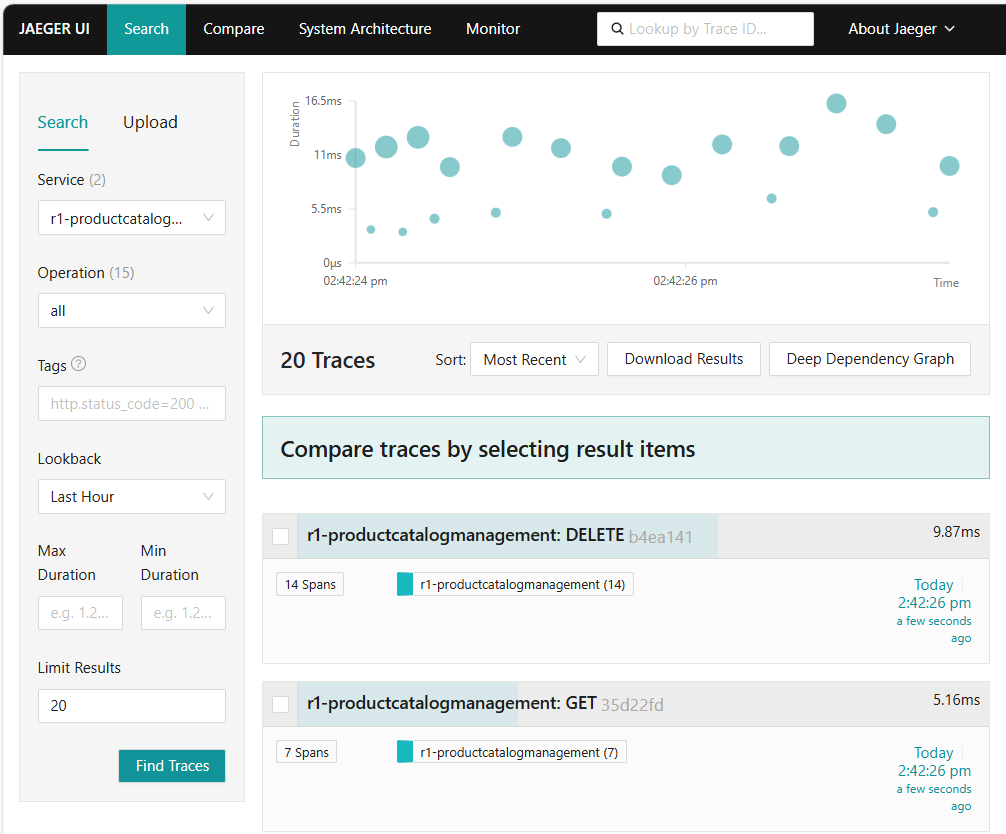
The component also generates Open-Telemetry events that can either be logged to the console using otlp.console.enabled:true or sent to an Open-Telemetry protobuffCollector. You can set this in the values.yaml file as follows:
  otlp:
    console:
      enabled: false
    protobuffCollector:
      enabled: true
      url: http://observability-opentelemetry-collector.monitoring.svc.cluster.local:4318/v1/traces
With telemetry enabled, you can view traces of executions in Jaeger:
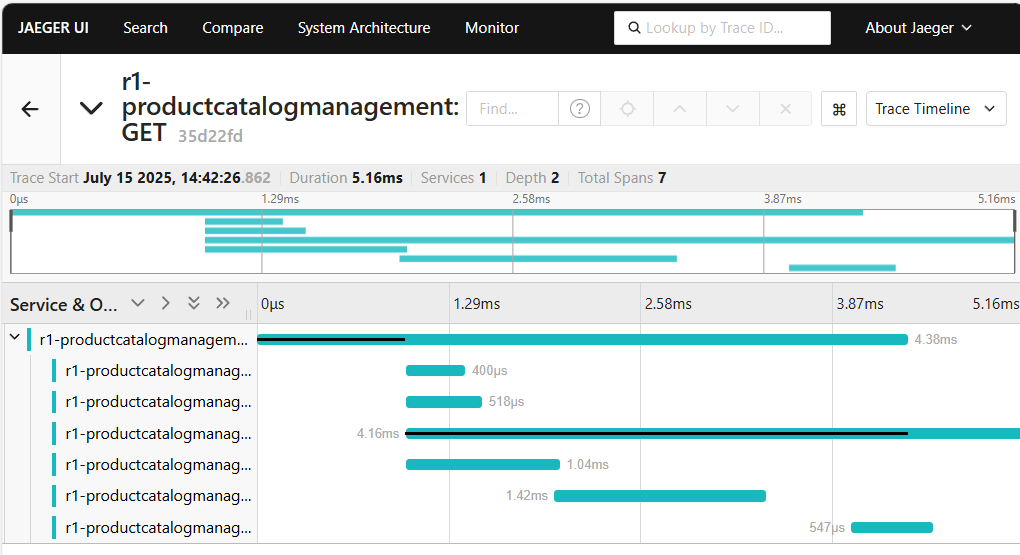
And drill down into an individual trace:
Contributing
Please read the CONTRIBUTING.md file for details on how to contribute to this project.
Support
For support, please create an issue in the ODA Canvas repository.